Tracking project stages is an essential part of project management, helping you monitor the progress of various tasks. But what if you could simplify this process using Google Sheets? In this blog post, we will walk you through how to create a Project Stages Tracker in Google Sheets, using a simple and effective formula to track project activities at each stage. By the end of this article, you’ll know exactly how to set it up!
Understanding the Project Stages Data
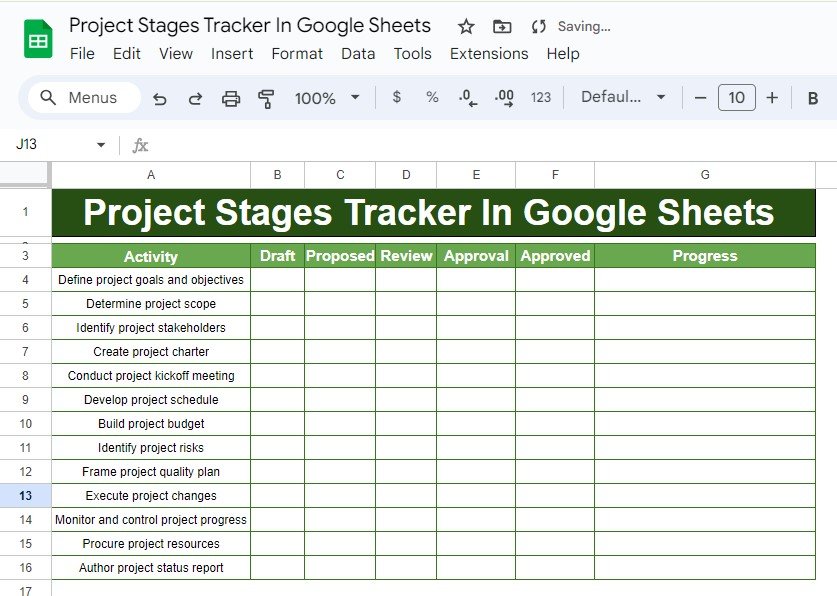
For our example, we have a set of activities that represent the various stages of a project. These activities need to go through multiple phases, from drafting to approval and eventually progress monitoring. Here’s a breakdown of the data we’re working with:
Each row represents a project activity, and the columns represent the various stages of the project: Draft, Proposed, Review, Approval, Approved, and Progress.

The Challenge: Tracking Project Stages
With so many stages and activities, manually tracking progress can quickly become overwhelming. Luckily, Google Sheets offers a simple yet powerful formula that can do the heavy lifting for us.
We’ll use the SPARKLINE function, which helps visualize progress through a bar chart representation within the cells. This makes it easy to see which tasks are advancing and which ones need attention.
The Formula
Here’s the magic formula we’ll be using to track project stages:
=SPARKLINE(COUNTIF(B4:F4,TRUE),{"charttype","bar";"max",5;"color1","green"})
Let’s break it down:
COUNTIF(B4:F4, TRUE) checks how many stages (Draft, Proposed, Review, Approval, Approved) have been completed for a specific activity.
{“charttype”,”bar”} tells Google Sheets to display a bar chart to represent the progress visually.
“max”,5 defines the maximum value (in our case, 5 stages), ensuring the bar is scaled correctly.
“color1″,”green” specifies the color of the bar, making it easy to see completed stages at a glance.
How It Works
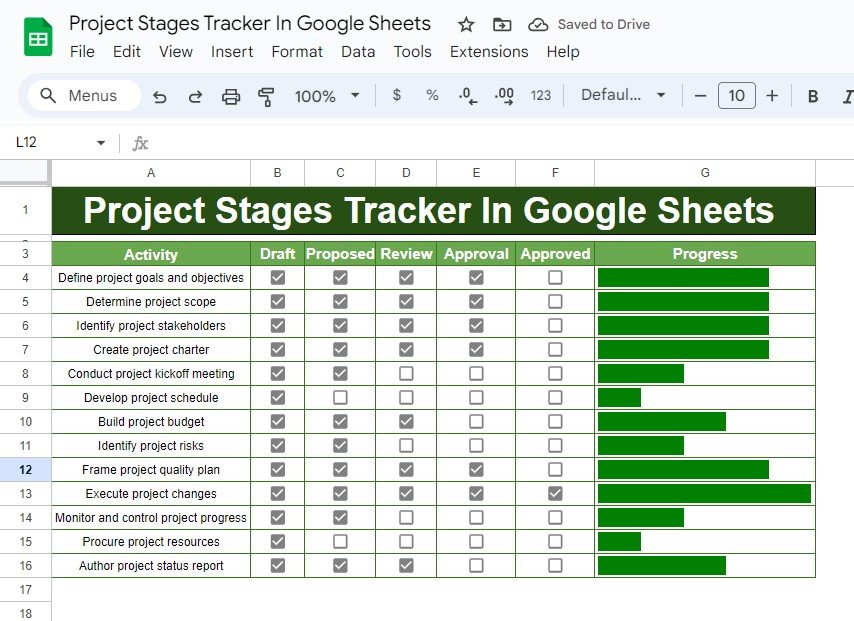
Once we apply this formula across the entire dataset, Google Sheets will automatically generate a bar chart in each row, showing the number of stages completed for each activity. Here’s how the output will look:
As you can see, each row visually represents the progress for each activity. Tasks with more stages completed will show longer green bars, while tasks in the earlier stages will have shorter bars or no bars at all.
![]()
Why Use a Project Stages Tracker in Google Sheets?
Now that we’ve explained how to set up the Project Stages Tracker, let’s highlight the benefits of using this method:
🎯 Clear Visual Representation
No need to manually check each stage; the bar chart gives you an instant snapshot of where each task stands.
⏱ Time-Saving
By automating the tracking process with formulas, you save time and reduce the chance of human error.
📊 Customizable
Easily adjust the stages or color schemes to fit your project’s needs, giving you a fully tailored solution.
Conclusion
By using the Project Stages Tracker in Google Sheets, you can streamline your project management process and get a clear visual overview of your team’s progress. Whether you’re working on small projects or large initiatives, this simple solution makes it easier to stay organized and on top of every task.
Visit our YouTube channel to learn step-by-step video tutorials
Youtube.com/@NeotechNavigators
View this post on Instagram


