Research and Development (R&D) plays a vital role in driving innovation, improving products, and sustaining business growth. To measure the effectiveness and efficiency of R&D initiatives, organizations need clear, quantifiable insights — and that’s where the R&D KPI Scorecard in Google Sheets comes in.
This ready-to-use scorecard template is designed to help R&D managers, project leads, and executives monitor key performance indicators (KPIs), track progress against targets, and analyze performance trends — all within a dynamic and interactive Google Sheets environment.
What Is an R&D KPI Scorecard in Google Sheets?
An R&D KPI Scorecard is a performance measurement tool that helps organizations evaluate their research and innovation activities through a structured set of key performance indicators.
The Google Sheets version of this scorecard automates calculations, provides visual insights (like traffic lights and arrows), and allows monthly and yearly performance tracking — without needing any additional software.
With this scorecard, you can:
-
Track monthly (MTD) and yearly (YTD) performance of all KPIs.
-
Instantly compare Actual vs Target vs Previous Year.
-
Visualize performance using conditional formatting (up/down arrows and color coding).
-
Analyze historical data through interactive trend charts.
Structure of the R&D KPI Scorecard
Click to Buy R&D KPI Scorecard in Google Sheets
This scorecard template contains several sheets designed for performance monitoring, analysis, and data input:
- Dashboard Sheet Tab
Trend Sheet Tab
KPI Definition Sheet Tab
Data Input Sheet Tab
Color Settings Sheet Tab
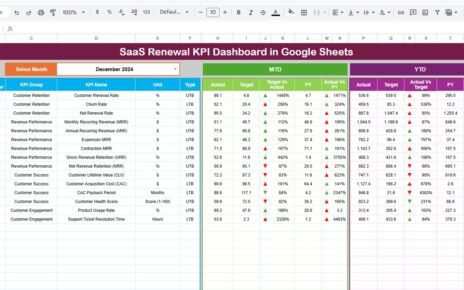
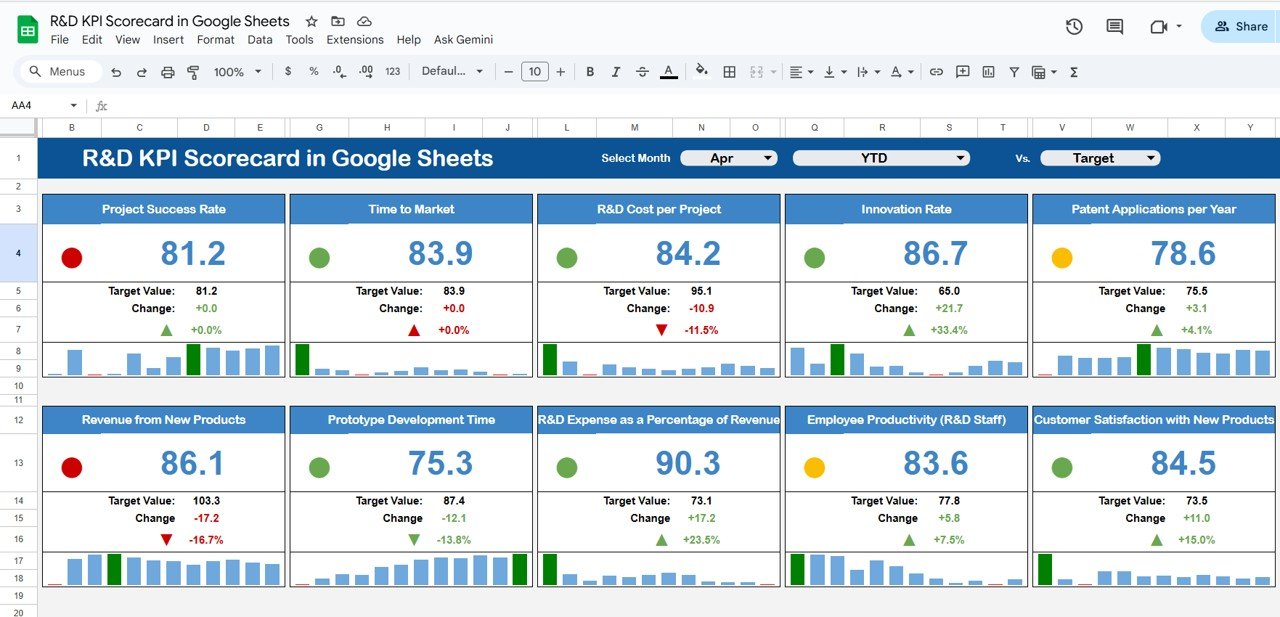
Dashboard Sheet Tab
This is the main visualization sheet, showing all KPIs and their current performance.
Features:
Month Dropdown (Cell D3): Select any month to automatically update all figures.
Data Views: Toggle between MTD (Month-to-Date) and YTD (Year-to-Date) metrics.
Comparative Indicators:
- Actual vs Target
- Actual vs Previous Year
Traffic Lights & Arrows:
- Green = On or above target
- Red = Below target
- Up Arrow = Improvement
- Down Arrow = Decline
This sheet allows managers to instantly interpret R&D performance at a glance.
Click to Buy R&D KPI Scorecard in Google Sheets
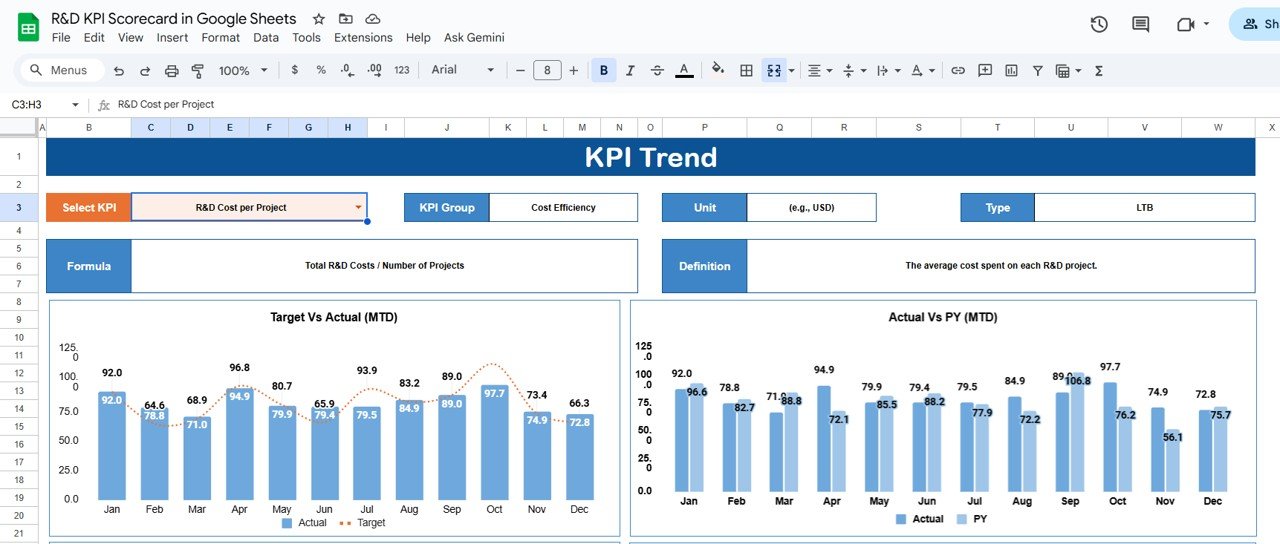
Trend Sheet Tab
The Trend Sheet provides detailed monthly analysis for each KPI.
Features:
Select the KPI name from the dropdown (Cell C3).
View KPI details including:
- KPI Group
- Unit
- Type (UTB / LTB)
- Formula
- Definition
Displays KPI performance across months in an easy-to-read trend chart.
This sheet helps identify improvement or decline trends over time.
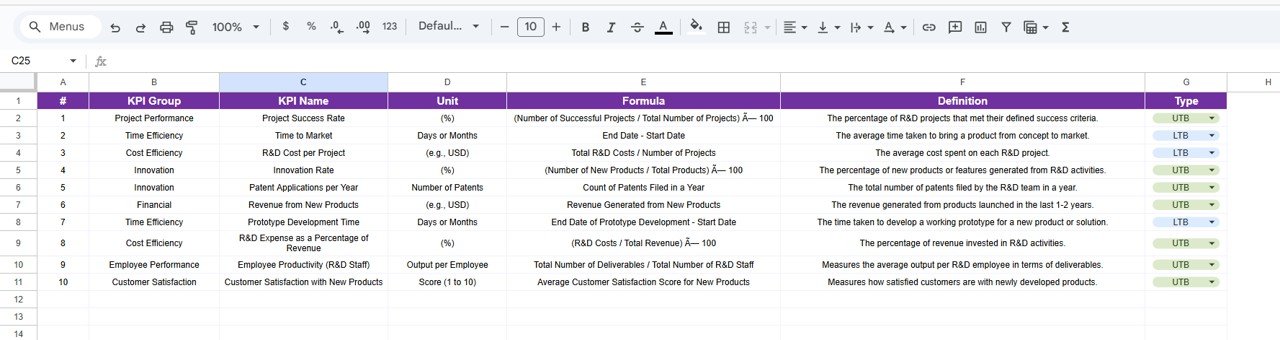
KPI Definition Sheet Tab
This sheet lists all KPIs, along with their groups, formulas, units, and definitions. It acts as a reference guide for maintaining data consistency.
Click to Buy R&D KPI Scorecard in Google Sheets
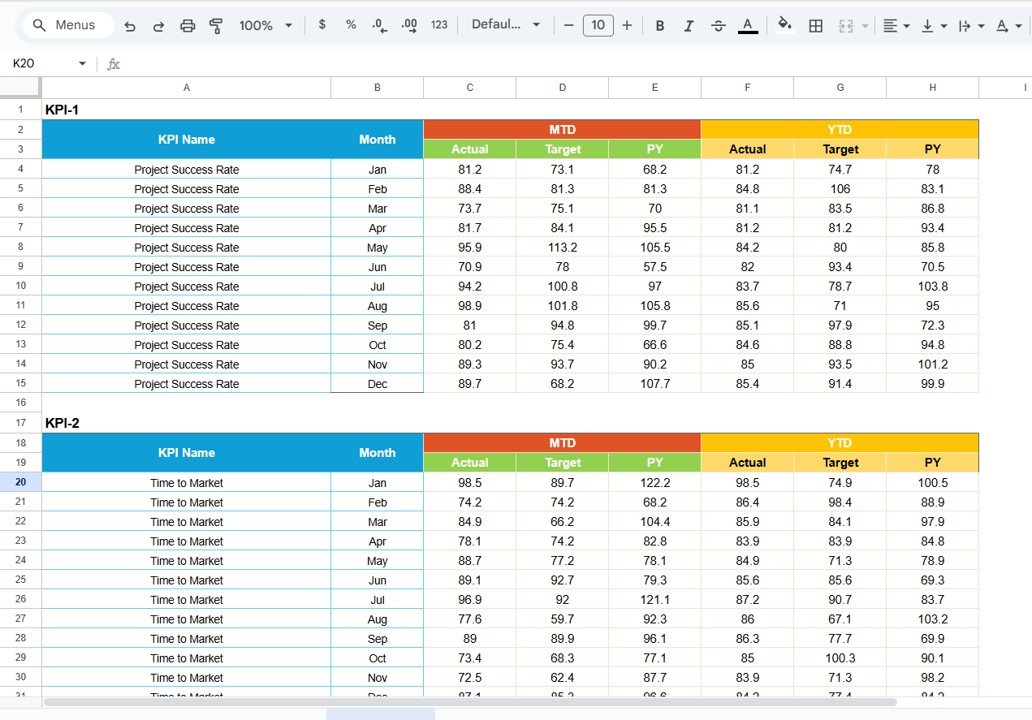
Data Input Sheet Tab
This is the data entry sheet where MTD and YTD values are recorded.
Usage:
-
Input Actual, Target, and Previous Year data for each KPI.
-
All dashboard visuals and calculations update automatically.
Click to Buy R&D KPI Scorecard in Google Sheets
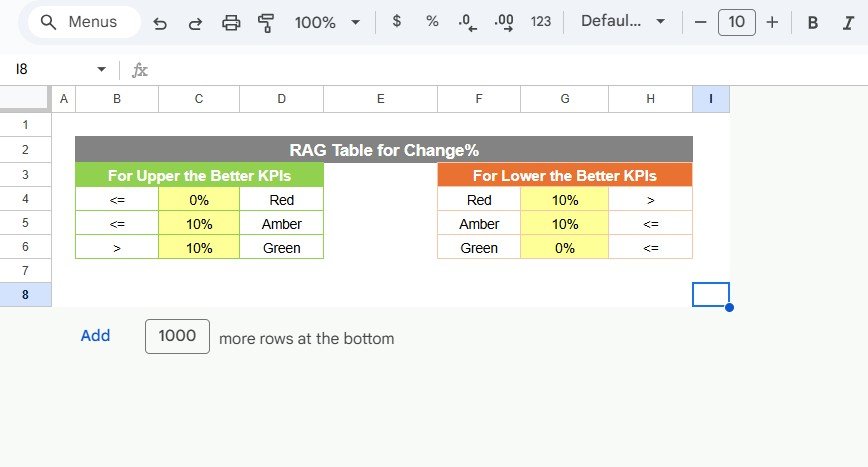
Color Settings Sheet Tab
This tab defines color codes and icons for conditional formatting.
-
Adjust threshold levels for performance (e.g., below 80% = Red, above 100% = Green).
-
Customize color schemes and indicators as needed.
-
Color Settings Sheet Tab
Advantages of the R&D KPI Scorecard
Click to Buy R&D KPI Scorecard in Google Sheets
-
Real-Time Insights: Automatically calculates KPI performance as data changes.
-
Comparative Analysis: Compare MTD, YTD, Target, and Previous Year data easily.
-
Visual Representation: Instantly understand performance with color-coded visuals.
-
Completely Customizable: Add more KPIs or modify existing ones per your R&D needs.
-
Collaborative and Cloud-Based: Built in Google Sheets for multi-user access.
-
Simple Yet Powerful: No complex tools or coding needed — just intuitive performance management.
Opportunities for Improvement
To make the scorecard even more insightful:
-
Add Milestone Tracking: Measure R&D phase completion progress.
-
Integrate Google Forms: Automate monthly data submissions from R&D teams.
-
Add Predictive KPIs: Forecast R&D ROI or project completion probability.
-
Include Resource Allocation Metrics: Track lab utilization or researcher workload.
-
Automate Reporting: Use Google Apps Script to send automated monthly summaries.
Best Practices
Click to Buy R&D KPI Scorecard in Google Sheets
-
Keep KPI definitions standardized across all departments.
-
Review and update KPI targets every quarter.
-
Input data consistently for all months.
-
Monitor monthly trends to detect performance gaps early.
-
Protect formula cells and color settings to avoid accidental changes.
Conclusion
The R&D KPI Scorecard in Google Sheets is a smart and structured tool for tracking research performance and innovation success.
It provides clarity, transparency, and agility to R&D management by combining essential performance indicators with automated insights and visual analytics.
Whether you’re leading a startup R&D team or managing a global innovation department, this scorecard empowers data-driven decision-making — helping transform research results into measurable business impact.
Visit our YouTube channel to learn step-by-step video tutorials