In today’s data-driven era, space technology organizations—from satellite manufacturers to launch service providers—need precise, real-time analytics to manage complex operations. The Space Tech KPI Dashboard in Google Sheets is a cutting-edge, ready-to-use analytical solution designed to help space agencies, research institutions, and aerospace companies track performance, efficiency, and mission outcomes effortlessly.
Built on Google Sheets, this dashboard offers an accessible yet powerful way to visualize key metrics, monitor trends, and make data-informed decisions—all within a single, cloud-based platform. Let’s explore how this dashboard transforms the way space organizations measure success and ensure mission excellence.
Click to buy Space Tech KPI Dashboard in Google Sheets
What Is a Space Tech KPI Dashboard in Google Sheets?
A Space Tech KPI Dashboard is a visual analytical tool that consolidates and monitors Key Performance Indicators (KPIs) related to space missions, satellite development, R&D efficiency, project timelines, and budget utilization.
Built using Google Sheets, it brings together multiple data points into one interactive, easy-to-use platform—allowing users to view MTD (Month-to-Date) and YTD (Year-to-Date) insights instantly.
Unlike traditional software that requires complex setup, this dashboard runs entirely in Google Sheets—making it accessible, collaborative, and cost-effective. With smart formulas, conditional formatting, and data validation, it delivers real-time analytics for faster and smarter decision-making.
Key Features of the Space Tech KPI Dashboard in Google Sheets
This dashboard includes six structured worksheet tabs, each serving a distinct analytical function.
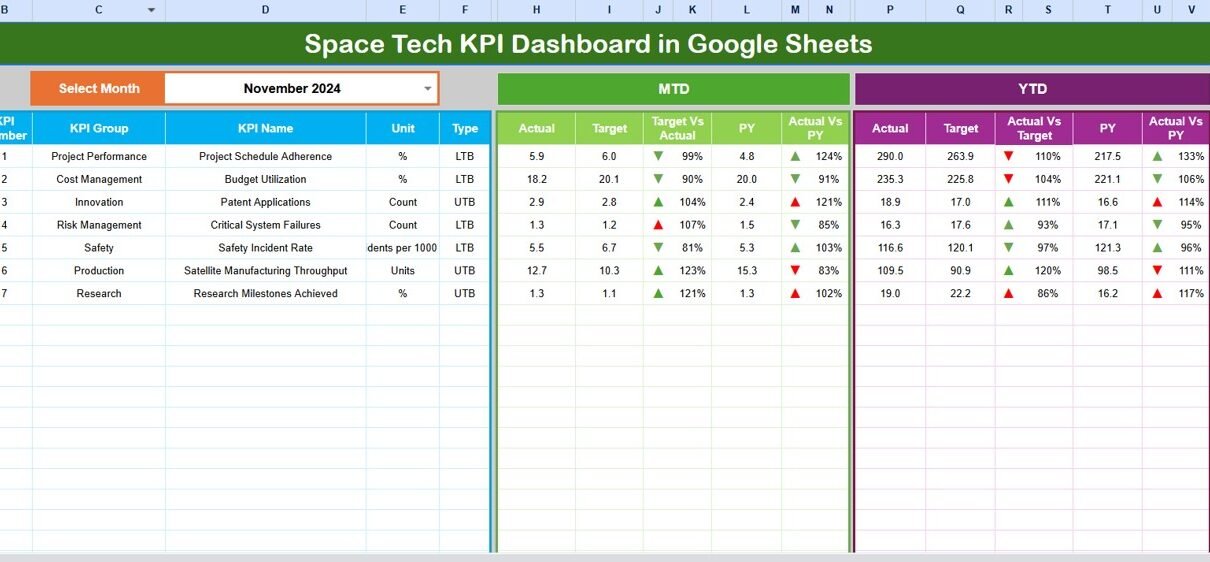
Dashboard Sheet Tab (Main Analytical View)
This is the core sheet tab, presenting a comprehensive overview of all KPIs.
You can select a specific month from the drop-down list in cell D3. Once selected, the dashboard automatically refreshes all figures for that month.
It displays:
- MTD Actuals, Targets, and Previous Year Data
- Target vs. Actual Comparison
- Previous Year vs. Actual Comparison
- YTD Aggregates and Conditional Formatting Arrows (📈/📉)
– Arrows instantly indicate performance trends (upward or downward movement).
This tab empowers decision-makers to get a quick snapshot of mission progress, cost efficiency, and operational performance.

Click to buy Space Tech KPI Dashboard in Google Sheets
KPI Trend Sheet Tab
This sheet focuses on individual KPI analysis.
You can select a KPI name from the dropdown menu in cell C3. The sheet then dynamically displays:
- KPI Group
- Unit of Measurement
- KPI Type ( Lower the Better or Upper the Better)
- Formula
- Definition

Click to buy Space Tech KPI Dashboard in Google Sheets
Actual Numbers Sheet Tab
This tab is the data input hub for actual monthly figures.
Users can select a month in cell E1 and input MTD and YTD values for each KPI.
It helps maintain historical data for consistent monthly tracking.
For example:
- MTD (Month-to-Date) values show current month progress.
- YTD (Year-to-Date) values track cumulative achievements since the start of the year.

Click to buy Space Tech KPI Dashboard in Google Sheets
Target Sheet Tab
In this tab, users define the expected performance targets for each KPI—both for MTD and YTD.
It supports:
- Monthly goal setting
- Annual planning
- Target benchmarking
By comparing target vs. actual, the dashboard reveals performance gaps and improvement areas immediately.

Previous Year Numbers Sheet Tab
This section stores data from the previous operational year.
It allows year-over-year comparison and trend evaluation, making it easier to track long-term progress.
For example:
- If your mission success rate was 82% last year and 90% this year, you instantly see a positive +8% improvement.
- Conditional formatting automatically highlights this trend in green (up arrow).

KPI Definition Sheet Tab
This tab provides the foundation of the dashboard.
Here, users define every KPI’s core details:
- KPI Group
- KPI Name
- Unit
- Formula
- Definition
- Type (UTB/LTB)
This ensures consistency, clarity, and standardization across all departments—whether it’s R&D, propulsion systems, satellite communications, or mission controlUsing Google Sheets for KPI monitoring in the space industry offers multiple advantages:
- Cloud-based accessibility – Access from anywhere, anytime.
- Real-time collaboration – Multiple teams (engineering, research, finance) can update and view simultaneously.
- Cost-effective solution – No expensive software required.
- Automation-ready – Integrate with Google Apps Script or Data Studio for advanced automation.
- Version control – Track every change effortlessly.
- Customizable interface – Tailor charts, slicers, and dashboards to your organization’s needs.
Advantages of Space Tech KPI Dashboard in Google Sheets
Let’s explore how this dashboard can add real value:
- Centralized Performance Tracking
All metrics—financial, operational, and technical—are monitored in one place. - Enhanced Transparency
Teams can view live performance updates, eliminating guesswork. - Data-Driven Decision Making
Decision-makers use actual vs. target data to adjust strategies in real time. - Improved Collaboration
Google’s sharing capabilities allow multiple stakeholders to access and edit data simultaneously. - Real-Time Updates
As soon as new data is entered, dashboards automatically refresh, ensuring accuracy. - Customizability
Every KPI, chart, and metric can be tailored to match organizational priorities.
Opportunities for Improvement
Even though the Space Tech KPI Dashboard in Google Sheets is powerful, there’s always room for improvement:
- Automate data collection through APIs for real-time telemetry feeds from satellites.
- Integrate visualization tools like Google Data Studio or Power BI for deeper insights.
- Enhance data security using Google Workspace access controls.
- Add AI-driven predictions for launch reliability and risk assessments.
- Expand KPI categories to include sustainability, mission impact, and innovation metrics.
These enhancements make the dashboard not just a monitoring tool but a predictive analytics platform.
Best Practices for the Space Tech KPI Dashboard in Google Sheets
To get the best results from your dashboard, follow these best practices:
- Define KPIs Clearly
Ensure every KPI has a specific formula, definition, and unit. Avoid ambiguity.
- Set Monthly and Yearly Targets
Establish MTD and YTD targets for consistency in tracking performance trends.
- Maintain Data Accuracy
Regularly validate inputs in the Actuals and Target sheets to maintain accuracy.
- Visualize Key Metrics
Use conditional formatting, charts, and color codes to highlight deviations quickly.
- Review Trends Periodically
Monitor KPI Trend sheets to identify long-term growth or performance decline.
- Encourage Cross-Functional Collaboration
Share the dashboard with R&D, Operations, Finance, and HR teams to ensure alignment.
- Protect Sensitive Data
Use Google’s Protected Range feature to restrict editing rights where necessary.
How to Use the Space Tech KPI Dashboard (Step-by-Step)
Open the Dashboard File in Google Sheets.
Go to the Dashboard Tab and select a month from the dropdown (D3).
Review the updated metrics, arrows, and color indicators.
To explore individual KPIs, go to the KPI Trend Tab and select a KPI.
Enter new data in Actuals and Target Tabs each month.
Compare performance with Previous Year Data.
Update the KPI Definition Tab whenever new metrics are introduced.
By following these steps, your space tech team can maintain a consistent, transparent, and efficient KPI tracking ecosystem.
Real-World Applications of the Dashboard
The Space Tech KPI Dashboard is suitable for various organizations:
- Satellite manufacturing firms
- Space research agencies (like ISRO, NASA)
- Aerospace startups
- Defense R&D labs
- Private space launch companies
It helps these organizations track mission success, cost efficiency, and innovation performance across all departments.
Conclusion
The Space Tech KPI Dashboard in Google Sheets redefines how the space industry monitors and evaluates its performance. By transforming raw data into visual insights, it empowers organizations to make strategic, data-driven decisions—faster and more efficiently.
With its structured design, monthly tracking, and comparison tools, this dashboard isn’t just a reporting mechanism—it’s a strategic command center for every space organization striving toward innovation, precision, and excellence.
Frequently Asked Questions (FAQs)
- What is a Space Tech KPI Dashboard?
It is a Google Sheets-based analytics tool designed to track key performance indicators related to space missions, engineering, and research.
- Who can use this dashboard?
It’s ideal for aerospace companies, space agencies, research institutions, and educational organizations involved in space technology projects.
- What makes it different from Excel dashboards?
Being cloud-based, Google Sheets enables real-time collaboration, easy sharing, and seamless integration with Google tools.
- Can this dashboard be customized?
Yes, you can easily modify KPI groups, formulas, and chart visuals to match your organization’s specific goals.
- How often should I update the dashboard?
It’s best to update it monthly with fresh actual and target data for accurate performance insights.
- Is it beginner-friendly?
Absolutely! Even non-technical users can manage it with simple dropdowns, color-coded charts, and clear KPI definitions.
Visit our YouTube channel to learn step-by-step video tutorials
Youtube.com/@NeotechNavigators
Watch the step-by-step video tutorial: