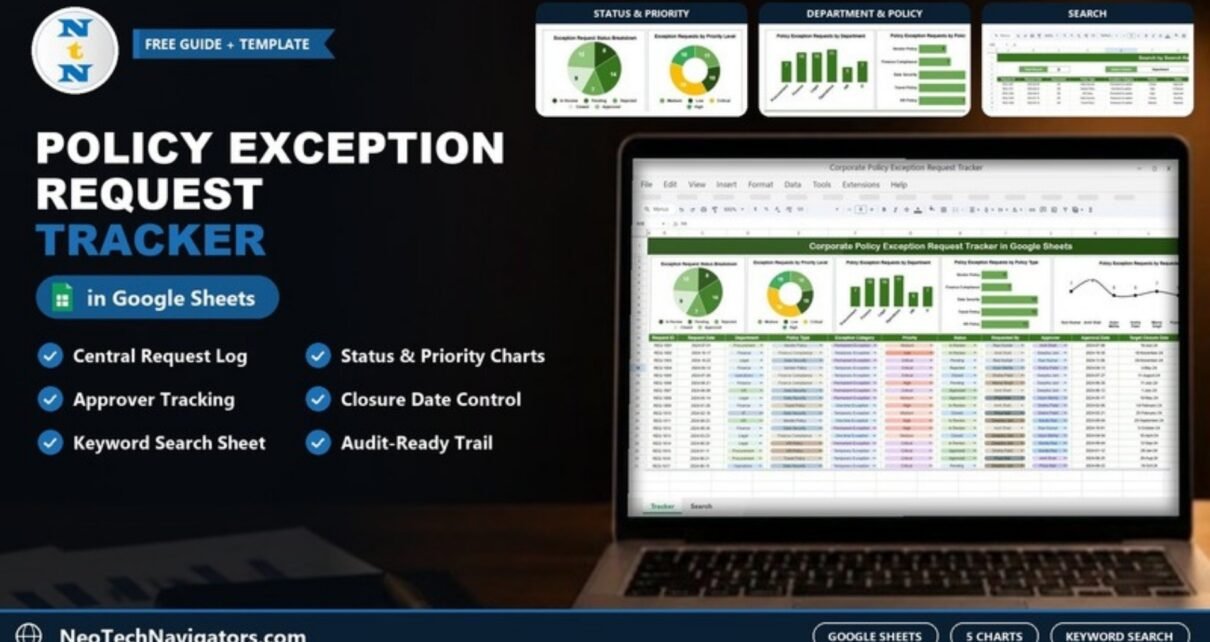
The Corporate Policy Exception Request Tracker in Google Sheets gives compliance, HR, finance and operations teams one shared place to log every request to bend a company policy, see who approved it, and spot which policies attract the most exceptions. Instead of chasing approvals across email threads and chat, each request gets an ID, a priority, an approver and a target closure date.
It is designed for governance and compliance leads, department heads and internal audit teams in small and mid-sized organisations. The template has two working areas: a Tracker sheet with five built-in charts above the request table, and a Search sheet that filters records by any column and keyword.
Below you will find what each part shows, the exact fields in the sample data, how to set it up for your own organisation, and where a spreadsheet tracker stops being enough.
🎥 Watch the Video Tutorial
Get the Policy Exception Request Tracker
Why Track Policy Exceptions at All?
A policy exception is a documented, approved deviation from a company rule — for example, letting a vendor start work before a full security review, or approving travel outside the standard policy. Exceptions are normal. The risk comes when nobody can say how many are open, who approved them, or whether a “temporary” exception quietly became permanent.
A central exception log answers those questions. It gives auditors a clean trail, helps managers see which approvals are stuck, and shows policy owners which rules generate so many requests that they may need rewriting.
Corporate Policy Exception Request Tracker: What Is Inside
1. Tracker Sheet With Five Charts
The Tracker sheet combines a chart panel at the top with the request table below it, so you see the summary and the detail on one screen. The five charts are:
- Exception Request Status Breakdown — a pie chart of requests by status: In Review, Pending, Rejected, Closed and Approved.
- Exception Requests by Priority Level — a doughnut chart split into Low, Medium, High and Critical.
- Policy Exception Requests by Department — a column chart for Procurement, Finance, Legal, Operations, HR and IT.
- Policy Exception Requests by Policy Type — a bar chart. In the sample, Data Security and Travel Policy lead with 13 requests each, followed by HR Policy (11), Finance Compliance (7) and Vendor Policy (6).
- Policy Exception Requests by Requested By — a line chart showing how many requests each person raised, such as Ravi Kumar, Amit Shah, Arjun Mehta, Sneha Patel, Manoj Singh, Priya Nair and Deepika Jain.
The sample data holds 50 requests (REQ-1001 onward), which is why the policy-type bars add up to 50.

The Request Table Columns
Each row in the table is one exception request. Most columns use dropdowns, which keeps values consistent so the charts count correctly.
| Column | What it records | Example from the sample |
|---|---|---|
| Request ID | Unique reference for the request | REQ-1001 |
| Request Date | When the request was raised | 2024-07-01 |
| Department | Requesting department | Procurement |
| Policy Type | Which policy the exception is against | Vendor Policy |
| Exception Category | How long the exception should last | Permanent, Temporary or One-time Exception |
| Priority | Urgency | Low, Medium, High, Critical |
| Status | Where the request stands | In Review, Pending, Approved, Rejected, Closed |
| Requested By | Person who raised it | Ravi Kumar |
| Approver | Person responsible for the decision | Amit Shah |
| Approval Date | When the decision was made | 2024-07-06 |
| Target Closure Date | When the exception should end or be closed | 15-July-24 |
| Severity Score | Numeric risk rating | Values from 1 to 10 in the sample |
| Comments | Free-text notes on the decision | Blank in the sample, ready for your notes |
2. Search Sheet: Search by Keyword and Field Name
The Search sheet answers questions like “show me every HR request” without touching filters on the main table. You choose a column in Select Column (Department, Status, Policy Type and so on), type a value in Search Keyword, and the matching rows appear below with the same 13 columns. A Total Record box shows how many rows matched.
In the screenshot, Department = HR returns 5 records: REQ-1007, REQ-1011, REQ-1020, REQ-1046 and REQ-1048, covering Data Security, Vendor Policy, HR Policy and Travel Policy exceptions.

How to Use the Tracker With Your Own Data
- Make your own copy in Google Drive and clear the sample rows from the request table (keep the header row and the dropdown cells).
- Review the dropdown lists for Department, Policy Type, Requested By and Approver. Replace the sample names with your own departments, policies and people.
- Log each new request with a Request ID, Request Date, Department, Policy Type, Exception Category and Priority. Set Status to Pending or In Review.
- Assign an Approver and a Target Closure Date as soon as the request is accepted for review.
- When a decision is made, update Status to Approved or Rejected and fill in the Approval Date. Record the reasoning in Comments.
- When a temporary or one-time exception ends, set Status to Closed so it drops out of your open count.
- Use the Search sheet before review meetings — for example, Status = Pending to build the agenda, or Policy Type = Data Security for the security team.
- Review the five charts monthly to see which departments and policies drive the most exceptions.
If you want a quick open-request count somewhere else in the workbook, a simple COUNTIF on the Status column works:
=COUNTIF(H15:H,"Pending")+COUNTIF(H15:H,"In Review")Adjust the range to wherever Status sits in your copy (column H, starting at row 15, in the sample layout).
Real-World Use Cases
- IT and information security: track Data Security exceptions such as temporary access or delayed patching, with a closure date so they do not become permanent by accident.
- Finance and procurement: log Vendor Policy and Finance Compliance exceptions, such as onboarding a supplier before all checks are complete, with a named approver for each.
- HR and travel: record HR Policy and Travel Policy exceptions, then use the department chart to show leadership where requests concentrate.
Best Practices
- Always set a Target Closure Date for Temporary and One-time exceptions, and review overdue ones weekly.
- Use the Severity Score consistently — agree what a 1 and a 10 mean so scores are comparable across departments.
- Keep dropdowns tidy. A misspelled department becomes a separate bar in the chart.
- Write the decision rationale in Comments. Auditors will ask why, not just who.
- Limit edit access. Use Data > Protect sheets and ranges so only the compliance team can change Status and Approver.
- Rely on File > Version history to see who changed a record and when.
Limitations and Who Should Not Use It
This is a spreadsheet log, not a workflow engine. It does not route requests to approvers, send reminders or enforce approval rules on its own; those steps happen through your team’s process. Regulated organisations that need tamper-proof audit trails, electronic signatures or formal segregation of duties should use a dedicated GRC (governance, risk and compliance) system and treat this tracker as a lightweight interim or departmental tool. Very high volumes — thousands of requests a year — will also be easier to manage in a database.
Related Trackers and Dashboards
For change control on projects, see the Project Scope Change Request Tracker in Google Sheets. Teams running wider compliance programmes may also find the Compliance Audit Tracker, the Legal Compliance Tracker and the IT Security Policy Checklist useful. For a management-level view, the Corporate Compliance Dashboard in Google Sheets summarises compliance status across the business.
If you want to build charts and summary views like these from your own data, the Pivot Tables & Dashboards course on NextGenTemplates Academy teaches the same counting and charting ideas step by step.
Frequently Asked Questions
What is a policy exception request?
It is a formal request to deviate from a company policy for a specific reason and period. It should name the policy, the reason, the approver and when the exception ends.
What is the difference between temporary, one-time and permanent exceptions?
A one-time exception covers a single event, a temporary exception covers a fixed period, and a permanent exception changes how the policy applies going forward. The tracker records this in the Exception Category column.
Which status values does the tracker use?
The sample uses In Review, Pending, Approved, Rejected and Closed. The Status chart counts requests in each.
How does the search work?
On the Search sheet, pick a column in Select Column, type a value in Search Keyword, and matching rows appear with a Total Record count. For example, Department = HR returns five requests in the sample.
Can I add my own departments and policy types?
Yes. Update the dropdown options for those columns and the charts will pick up the new values as you log requests against them.
Does the tracker help with audits?
Yes. Every request has an ID, requester, approver, approval date and target closure date, which gives auditors a clear record of who approved what and when.
Wrapping Up
The Corporate Policy Exception Request Tracker in Google Sheets turns scattered exception approvals into one searchable log with five charts that show where requests come from and which policies they target. Load your departments and approvers, log the next request you receive, and use the Search sheet at your next review meeting.
Get the Corporate Policy Exception Request Tracker
📅 Last updated: October 2026