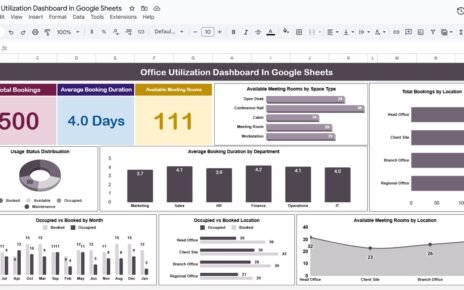
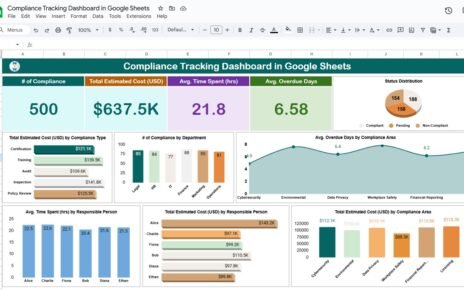
In today’s fast-paced property market, real estate professionals need quick insights, organized data, and visually appealing tools to manage listings, costs, and client engagement. A Real Estate Dashboard in Google Sheets offers just that—a dynamic, cloud-based solution that streamlines real estate analytics and simplifies decision-making.
This article will walk you through everything you need to know about this ready-to-use dashboard. Whether you’re a real estate agent, property manager, or investor, you’ll discover how this tool can help you track performance, visualize trends, and stay ahead in the competitive property industry.
What Is a Real Estate Dashboard in Google Sheets?
A real estate dashboard is a centralized tool that displays key property metrics using cards, charts, and tables. Built in Google Sheets, this dashboard is not only easy to use but also collaborative and always accessible from any device.
It combines three essential worksheet tabs:
-
Dashboard – Visual insights
-
Data – Centralized input sheet
-
Support – Dropdown and reference list management
Let’s explore each in detail.
Inside the Dashboard Sheet: Cards and Charts That Matter
Click to buy Real Estate Dashboard in Google Sheets
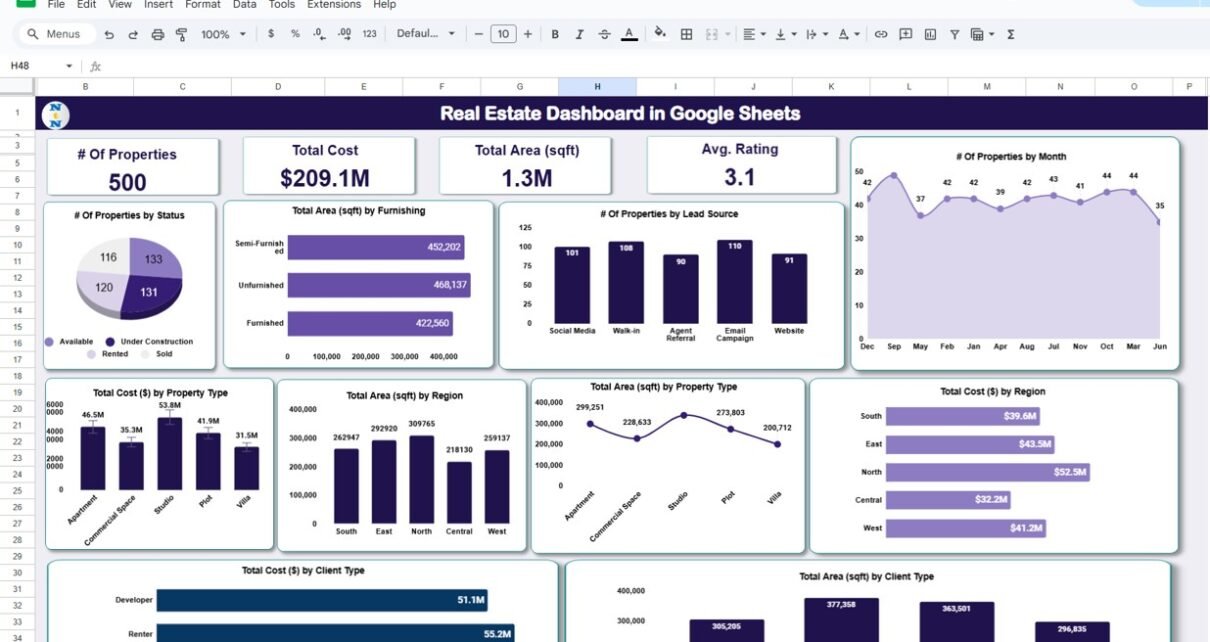
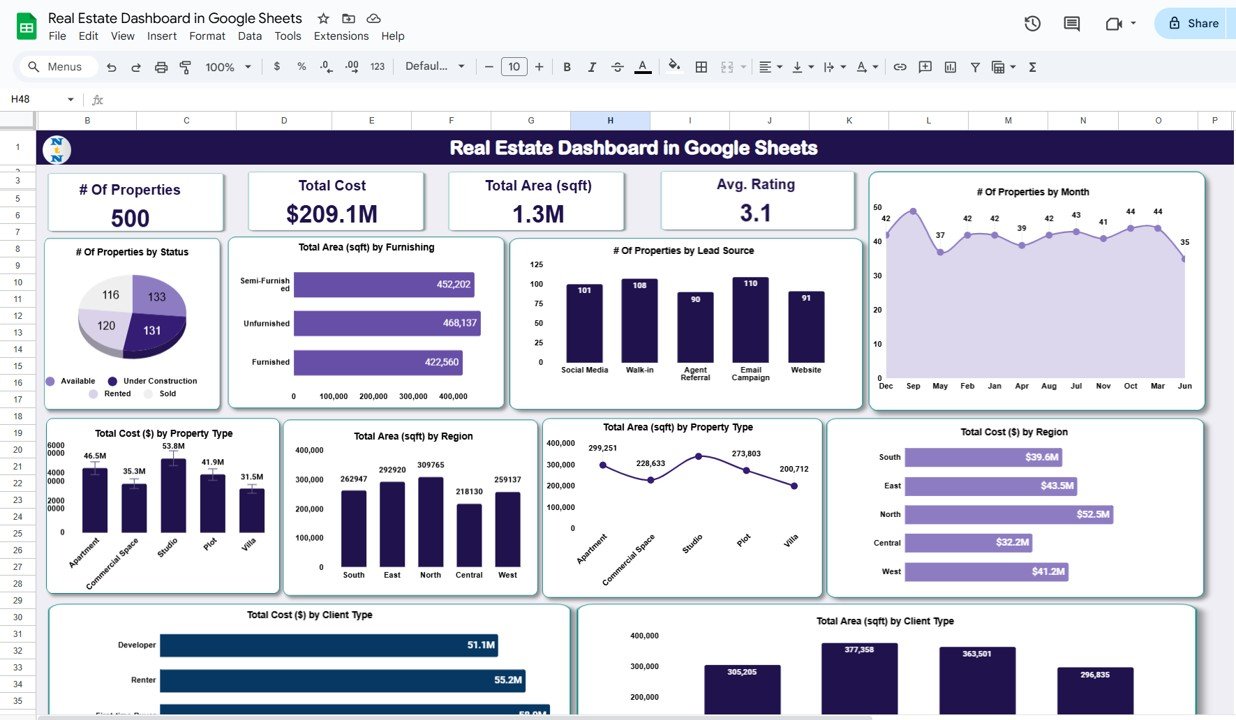
The Dashboard sheet tab is the visual heart of this tool. It uses cards and charts to present a quick snapshot of real estate metrics. This makes it easy to monitor key performance indicators (KPIs) at a glance.
Key Cards Displayed
These summary cards give a real-time overview of your property portfolio:
-
# of Properties – Total number of listed properties.
-
Total Cost ($) – Aggregate monetary value of all properties.
-
Total Area (sqft) – Cumulative area of properties measured in square feet.
-
Average Rating – Mean customer or agent rating (e.g., from feedback or scoring system).
Powerful Charts for Trend Analysis
The dashboard also includes multiple charts that break down performance by different dimensions:
-
# of Properties by Status (e.g., Available, Sold, Under Offer)
-
Total Area (sqft) by Furnishing (Furnished, Semi-Furnished, Unfurnished)
-
# of Properties by Lead Source (Referral, Website, Social Media, Walk-in)
-
# of Properties by Month (for seasonal analysis)
-
Total Cost ($) by Property Type (Residential, Commercial, Land)
-
Total Area (sqft) by Region (North, South, East, West)
-
Total Area (sqft) by Property Type
-
Total Cost ($) by Region
-
Total Cost ($) by Client Type (First-time buyer, Investor, Developer)
-
Total Area (sqft) by Client Type
All these charts update automatically as new data is added to the Data tab.
Click to buy Real Estate Dashboard in Google Sheets
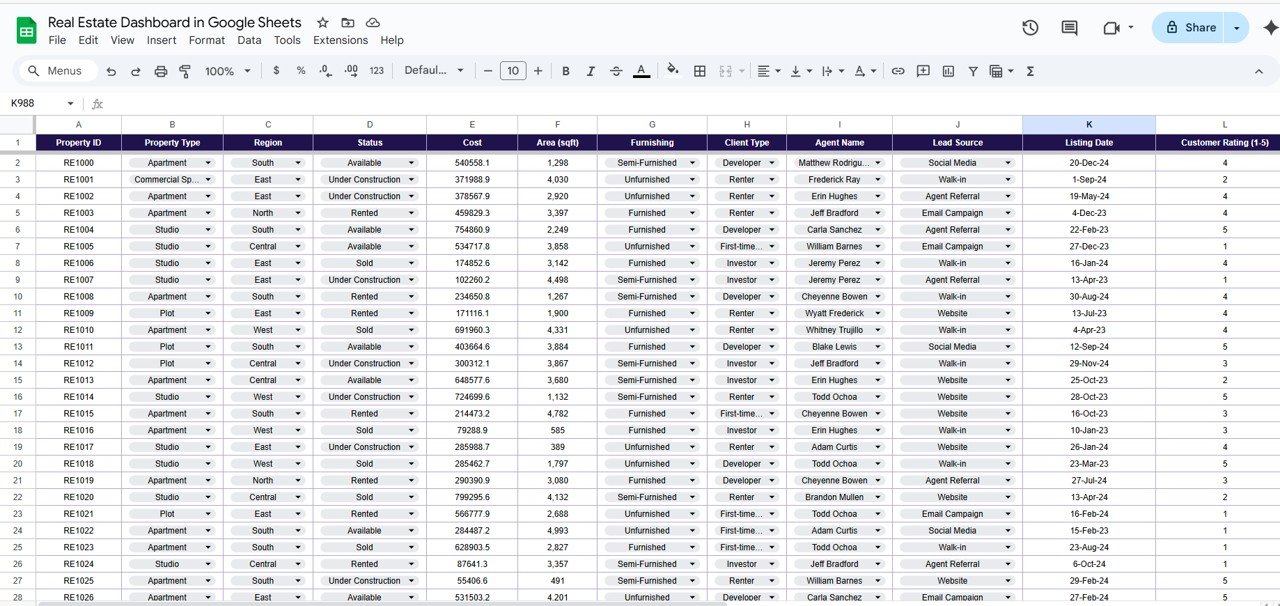
Data Sheet Tab: Centralized Property Information
The Data sheet acts as the foundation of your dashboard. It’s where you enter all your property listings and details.
Every row represents one property, and the dashboard pulls live data from this sheet to update the charts and cards. Since it’s Google Sheets, you can collaborate with your team, apply filters, and audit updates in real-time.
Click to buy Real Estate Dashboard in Google Sheets
Support Sheet Tab: Seamless Dropdown Management
The Support sheet stores all reference data used for creating dropdown lists in the Data tab. This helps:

Click to buy Real Estate Dashboard in Google Sheets
Advantages of Real Estate Dashboard in Google Sheets
There are several benefits to using this dashboard template:
- Real-Time Collaboration; You can share the Google Sheet with your team, assign access permissions, and make updates together—even if you’re in different locations.
- No Need for Costly Software: Google Sheets is free to use. This template brings powerful dashboard functionality without the cost of BI tools or software licenses.
- Customizable to Your Needs: You can easily change chart types, colors, or even add filters to match your brand and business needs.
- Centralized Data Management: No more switching between files or versions. Everything is in one place—simple, neat, and always up to date.
- Easy to Update: New properties? Just add a new row in the Data tab. The dashboard updates instantly, saving hours of manual work.
Opportunities for Improvement in Real Estate Dashboards
Click to buy Real Estate Dashboard in Google Sheets
Even though this template is robust, there’s always room to improve. Here are some ideas:
-
Automated Email Alerts – Integrate with Google Apps Script to send alerts for status changes.
-
Include Timeline or Gantt View – Track sales pipeline or renovation timelines.
-
Add Notes or Comments Section – Add buyer/seller comments or feedback.
-
Search & Filter Panel – Build a dashboard-level filter by region, type, or client.
-
Form Integration – Link a Google Form to populate the Data tab directly from mobile or web.
Best Practices for Using the Real Estate Dashboard
Follow these tips to get the best out of your Google Sheets dashboard:
- Keep Your Data Clean: Always use dropdowns and avoid free text where possible. It ensures consistency and accurate reporting.
- Refresh Regularly: Though Google Sheets updates instantly, reviewing your data weekly ensures nothing falls through the cracks.
- Use Conditional Formatting: Highlight urgent properties (e.g., unsold for >90 days) with color-coded cells.
- Share with the Right Permissions: Use View Only for external stakeholders and Editor for team members.
- Backup Weekly: Even with autosave, download a weekly Excel version for secure archiving
Click to buy Real Estate Dashboard in Google Sheets
Conclusion
Managing real estate properties doesn’t have to be a hassle. With this Real Estate Dashboard in Google Sheets, you can bring order, insights, and efficiency to your operations. It saves time, enhances teamwork, and empowers you with the analytics you need to make better decisions.
This template is not only practical and professional but also extremely user-friendly. With zero coding or BI tool experience required, anyone from realtors to brokers can use it immediately.
Frequently Asked Questions (FAQs)
Click to buy Real Estate Dashboard in Google Sheets
1. Can I use this dashboard without any technical skills?
Yes! This dashboard is built for non-technical users. Just fill in the Data tab and the charts/cards will update automatically.
2. Can I customize the dashboard charts?
Absolutely. Since it’s built in Google Sheets, you can edit or replace charts based on your preferences.
3. Is this dashboard mobile-friendly?
Yes, Google Sheets is mobile-accessible, and the dashboard adjusts well on mobile devices for viewing purposes.
4. Can I track leads and clients with this template?
Yes. You can include client types and lead sources to track the origin and profile of your prospects.
5. How many properties can I manage using this?
There’s no technical limit. You can manage hundreds or even thousands of records depending on your usage and sheet performance.
6. Can I connect this to Google Forms or other tools?
Yes. You can integrate Google Forms to collect property or client data directly into the Data tab.
Visit our YouTube channel to learn step-by-step video tutorials
Youtube.com/@NeotechNavigators
Watch the step-by-step video Demo:
