Recruitment is a critical function within any organization, and having clear metrics to assess performance is essential. The Recruitment KPI Dashboard in Google Sheets is a powerful tool designed to help businesses track the effectiveness of their recruitment efforts. This dashboard provides a clear overview of key performance indicators (KPIs), helping HR professionals and managers evaluate and optimize their recruitment processes.
In this article, we’ll explore the features of this dashboard, how it works, and how it can benefit your organization by providing valuable insights into your recruitment performance.
What is the Recruitment KPI Dashboard in Google Sheets?
The Recruitment KPI Dashboard in Google Sheets is a dynamic tool that helps organizations monitor and analyze their recruitment efforts. It allows HR teams to track essential recruitment metrics such as the number of hires, cost per hire, time to hire, and more. The dashboard is customizable, so you can tailor it to your specific recruitment needs.
This dashboard includes six key worksheets, each designed to track and analyze different aspects of the recruitment process.
Key Features of the Recruitment KPI Dashboard
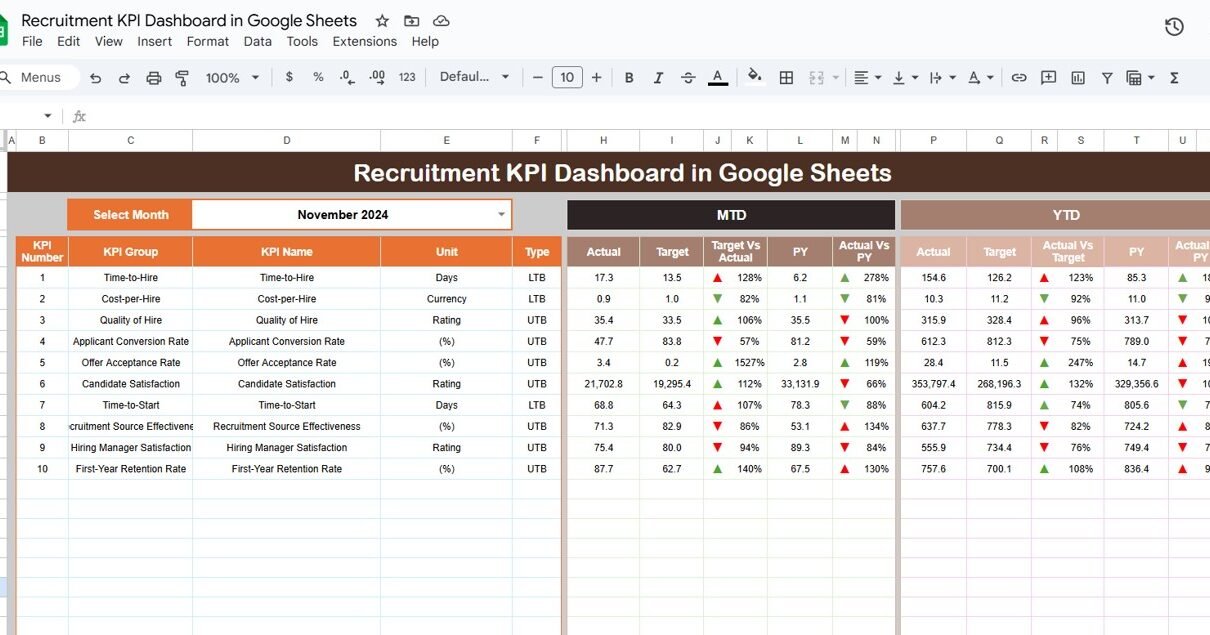
1) Dashboard Sheet Tab: The Central Hub
The Dashboard Sheet Tab serves as the main interface for the Recruitment KPI Dashboard. It provides an overview of all the KPIs for the selected month. Here’s what you’ll find:
Month-to-Date (MTD) and Year-to-Date (YTD) Metrics:
- MTD Actual: Shows the actual recruitment data for the selected month.
- MTD Target: Displays the target numbers for the selected month.
- PY MTD: Compares the current MTD numbers with the previous year’s MTD.
- Target vs Actual (MTD & YTD): Compares actual numbers with targets for both MTD and YTD, with conditional formatting that uses up and down arrows to indicate performance.
- PY vs Actual (MTD & YTD): Compares the current data with previous year data, giving you a sense of year-over-year progress.
These metrics are displayed clearly, making it easy to assess the recruitment performance at a glance.

Click to buy Recruitment KPI Dashboard in Google Sheets
2) KPI Trend Sheet Tab: Deep Dive into Individual KPIs
The KPI Trend Sheet provides a deeper analysis of each KPI. It allows you to select a specific KPI from a dropdown list (available in range C3), and you’ll see the following information:
-
KPI Group: The category or group the KPI belongs to (e.g., cost, time, quality).
-
Unit: The unit of measurement for the KPI (e.g., number of hires, cost per hire).
-
KPI Type: Whether the KPI is Lower the Better (LTB) or Upper the Better (UTB).
-
Formula: The formula used to calculate the KPI.
-
Definition: A brief description of what the KPI represents and how it’s measured.
This sheet allows you to dig into the details of individual KPIs, providing clarity on what each metric tracks and how it contributes to overall recruitment success.

Click to buy Recruitment KPI Dashboard in Google Sheets
3) Actual Number Sheet Tab: Enter Actual Recruitment Data
The Actual Number Sheet is where you enter the actual recruitment data for each KPI. You can input the values for both MTD and YTD for a specific month. Simply update the Start Month in range E1, and the data will adjust accordingly. This sheet helps ensure that the dashboard remains up-to-date with real-time recruitment data.

4) Target Sheet Tab: Set Recruitment Targets
In the Target Sheet, you’ll enter your recruitment targets for each KPI. These targets are set for both MTD and YTD, helping you monitor whether your recruitment efforts are on track to meet your goals.

Click to buy Recruitment KPI Dashboard in Google Sheets
5) Previous Year Number Sheet Tab: Compare with Last Year’s Data
The Previous Year Number Sheet allows you to input data from the previous year. By comparing this data with the current year’s numbers, you can assess how your recruitment efforts have progressed and identify areas for improvement.

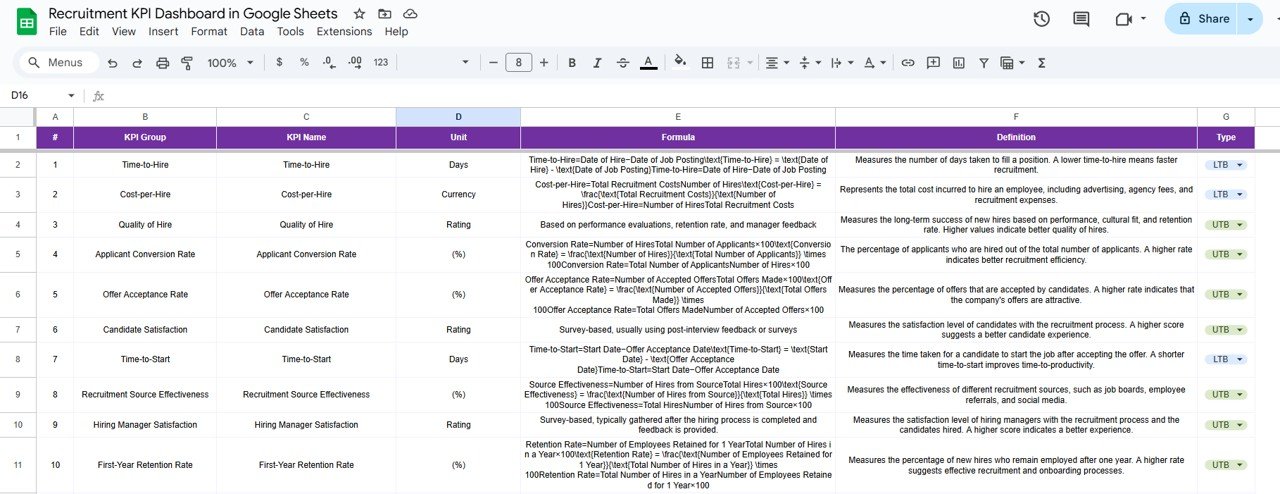
6) KPI Definition Sheet Tab: Clarify Each KPI
The KPI Definition Sheet provides a detailed overview of each KPI, including:
-
KPI Name
-
KPI Group
-
Unit of Measurement
-
Formula
-
Definition
This sheet ensures that every KPI is clearly defined and understood, helping you track performance accurately.
Click to buy Recruitment KPI Dashboard in Google Sheets
Benefits of Using the Recruitment KPI Dashboard
The Recruitment KPI Dashboard provides several key benefits to organizations looking to optimize their recruitment processes:
-
Comprehensive Overview: The dashboard gives a snapshot of key recruitment metrics, making it easy to monitor progress and identify areas for improvement.
-
Data-Driven Decisions: By tracking KPIs like time to hire, cost per hire, and quality of hire, you can make informed decisions about your recruitment strategies.
-
Real-Time Tracking: The dashboard updates automatically as you enter new data, allowing you to track your recruitment performance in real-time.
-
Customizable: The dashboard is fully customizable to fit your unique recruitment needs, whether you’re tracking hires, costs, or other important metrics.
-
Historical Comparison: The ability to compare current performance with previous years gives you valuable insights into long-term trends and progress.
Best Practices for Using the Recruitment KPI Dashboard
To get the most out of the Recruitment KPI Dashboard, follow these best practices:
-
Regularly Update Data: Keep the dashboard up-to-date by entering actual recruitment numbers on a regular basis. This ensures that your data reflects the current recruitment performance.
-
Set Realistic Targets: Set achievable targets based on historical data and current trends to help guide your recruitment efforts.
-
Monitor Key KPIs: Focus on the KPIs that matter most to your recruitment goals, such as time to hire, cost per hire, and source of hire.
-
Compare with Previous Year: Regularly review the PY vs Actual comparison to assess year-over-year progress and adjust your strategies accordingly.
-
Collaborate with the Recruitment Team: Share the dashboard with your recruitment team to ensure everyone is aligned and working toward the same goals.
Conclusion
The Recruitment KPI Dashboard in Google Sheets is an invaluable tool for monitoring and optimizing your recruitment processes. With clear, visual insights into key recruitment metrics, real-time data tracking, and customizable features, this dashboard helps you stay on top of your recruitment performance and make data-driven decisions. Whether you’re tracking time to hire, cost per hire, or other KPIs, this tool gives you the information you need to improve your recruitment efforts.
Click to buy Recruitment KPI Dashboard in Google Sheets
Frequently Asked Questions (FAQs)
1. What KPIs can I track using the Recruitment KPI Dashboard?
You can track a variety of KPIs, such as time to hire, cost per hire, quality of hire, source of hire, and more.
2. How often should I update the Recruitment KPI Dashboard?
It’s recommended to update the dashboard monthly to keep track of your progress and adjust strategies as needed.
3. Can I customize the KPIs in the dashboard?
Yes, the dashboard is fully customizable. You can modify existing KPIs or add new ones based on your recruitment goals.
4. How does the dashboard help with recruitment performance improvement?
By tracking and visualizing your KPIs, the dashboard helps you identify areas for improvement, set realistic targets, and make informed decisions.
5. Can I use this dashboard for multiple recruitment campaigns?
Yes, you can customize the dashboard to track performance across multiple recruitment campaigns or job openings.
Visit our YouTube channel to learn step-by-step video tutorials
Youtube.com/@NeotechNavigators