Reinsurance companies manage complex portfolios, high-value risks, multiple treaties, and long-term financial exposures. Because of this complexity, tracking performance manually becomes difficult and error-prone. Decision-makers need fast visibility into premiums, claims, recoveries, profitability, and risk exposure. This is where a Reinsurance KPI Dashboard in Google Sheets becomes an essential tool.
A Reinsurance KPI Dashboard in Google Sheets provides a centralized, ready-to-use solution to monitor operational, financial, and risk-related KPIs. It converts raw reinsurance data into actionable insights using structured KPIs, dynamic month selection, trend analysis, and year-to-date comparisons.
In this article, we explain how the dashboard works, its worksheet structure, the complete KPI list with formulas, and how reinsurance teams can use it to improve performance, control risk, and enhance profitability.
What Is a Reinsurance KPI Dashboard in Google Sheets?
A Reinsurance KPI Dashboard in Google Sheets is a performance management tool designed to track and analyze key metrics related to reinsurance operations. It focuses on premiums, claims, recoveries, loss ratios, exposure, treaty performance, and profitability.
Because it runs on Google Sheets, the dashboard offers:
- Real-time updates
- Cloud-based access
- Easy collaboration
- Automated calculations
- Zero dependency on complex software
It works perfectly for reinsurers, insurers, risk analysts, finance teams, and senior management.
Key Features of the Reinsurance KPI Dashboard
Click to Buy Reinsurance KPI Dashboard in Google Sheets
This dashboard is a ready-to-use template with a structured layout and automated calculations. It includes:
- Month selector for dynamic analysis
- MTD and YTD performance tracking
- Target vs Actual comparison
- Previous Year comparison
- KPI trend analysis
- Centralized KPI definition control
Worksheet Structure of the Dashboard
The Reinsurance KPI Dashboard contains 7 structured worksheet tabs, each serving a specific purpose.
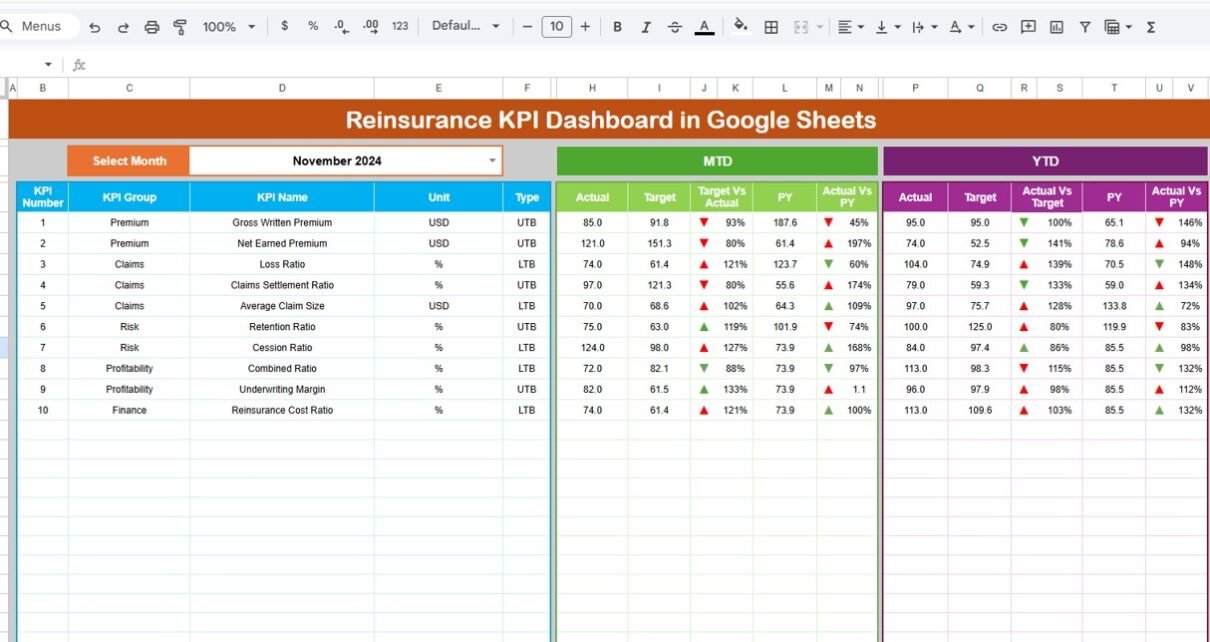
1. Dashboard Sheet Tab (Main Page)
This is the main summary page of the dashboard.
-
On cell D3, you select the month from a dropdown.
-
Once the month changes, all KPIs update automatically.
The dashboard displays:
MTD Section
- MTD Actual
- MTD Target
- MTD Previous Year
- Target vs Actual
- Previous Year vs Actual
YTD Section
- YTD Actual
- YTD Target
- YTD Previous Year
- Target vs Actual
- Previous Year vs Actual
Conditional formatting with up/down arrows highlights performance:
-
Green arrow → favorable performance
-
Red arrow → unfavorable performance
This page is ideal for leadership reviews and monthly performance meetings.

Click to Buy Reinsurance KPI Dashboard in Google Sheets
2. KPI Trend Sheet Tab
This sheet allows deep-dive analysis of individual KPIs.
-
Select the KPI name from the dropdown in cell C3.
The sheet displays:
- KPI Group
- Unit
- KPI Type (LTB / UTB)
- KPI Formula
- KPI Definition
It also shows month-wise trends to identify improvement patterns or risk areas.

Click to Buy Reinsurance KPI Dashboard in Google Sheets
3. Actual Number Sheet Tab
This sheet captures actual performance values.
- Enter MTD and YTD actual numbers.
- Select the first month of the year in cell E1.
- All calculations align automatically for the year.
This sheet acts as the primary data input layer.

4. Target Sheet Tab
This sheet stores monthly and YTD targets for each KPI.
Targets help management track:
- Performance expectations
- Strategic goals
- Operational benchmarks

Click to Buy Reinsurance KPI Dashboard in Google Sheets
5. Previous Year Number Sheet Tab
This sheet stores last year’s KPI values.
It supports:
- Year-on-Year comparison
- Long-term performance evaluation
- Trend benchmarking

6. KPI Definition Sheet Tab
This is the control center of the dashboard.
It includes:
- KPI Name
- KPI Group
- Unit
- Formula
- Definition
- KPI Type (LTB / UTB)
This ensures consistency, clarity, and transparency across all reports.

Click to Buy Reinsurance KPI Dashboard in Google Sheets
Advantages of the Reinsurance KPI Dashboard
-
Centralized reinsurance performance tracking
-
Clear visibility into profitability and risk
-
Faster decision-making
-
Improved treaty management
-
Better capital allocation
-
Reduced reporting effort
-
Easy collaboration across teams
Opportunities for Improvement in Reinsurance KPI Tracking
Click to Buy Reinsurance KPI Dashboard in Google Sheets
-
Integration with policy administration systems
-
Automated data feeds from underwriting platforms
-
Scenario and stress testing models
-
Catastrophe risk simulations
-
Advanced treaty-level analytics
-
Multi-currency reporting
Best Practices for Using the Reinsurance KPI Dashboard
-
Update actual numbers monthly
-
Review loss and combined ratios regularly
-
Track treaty-level profitability
-
Compare MTD and YTD trends together
-
Use previous-year comparison for strategic planning
-
Maintain consistent KPI definitions
Conclusion
Click to Buy Reinsurance KPI Dashboard in Google Sheets
A Reinsurance KPI Dashboard in Google Sheets gives reinsurers a powerful, flexible, and cost-effective way to manage performance. It transforms complex reinsurance data into meaningful insights that improve underwriting discipline, risk control, and financial stability. With structured KPIs, automated calculations, and clear visual comparisons, this dashboard becomes a critical tool for modern reinsurance management.
Frequently Asked Questions (FAQs)
1. Who should use this Reinsurance KPI Dashboard?
Reinsurance companies, insurers, actuaries, finance teams, and risk managers.
2. Can KPIs be customized?
Yes, all KPIs and formulas can be modified.
3. Does it support MTD and YTD analysis?
Yes, both are built in by default.
4. Is Google Sheets secure for reinsurance data?
Yes, with proper access controls.
5. Can it handle large portfolios?
Yes, it scales well for large datasets.
6. Does it support trend analysis?
Yes, the KPI Trend sheet enables deep analysis.
Visit our YouTube channel to learn step-by-step video tutorials
Youtube.com/@NeotechNavigators
Watch the step-by-step video tutorial: