In today’s digital-first world, a brand’s reputation is its greatest asset. Every customer review, social media comment, and online rating can either strengthen or damage your brand image. That’s why monitoring and improving brand reputation has become a strategic priority for businesses across industries.
However, tracking brand sentiment, customer feedback, and performance metrics manually can be time-consuming and inconsistent. This is where the Reputation Management KPI Dashboard in Google Sheets comes into play.
This ready-to-use and fully customizable dashboard helps businesses track and analyze key performance indicators (KPIs) related to brand reputation — such as review ratings, sentiment trends, customer engagement, and response times — all in one place. Built in Google Sheets, it’s simple to use, easy to share, and ideal for teams that value real-time collaboration.
In this article, we’ll explore everything you need to know about this tool, including its structure, features, benefits, best practices, and frequently asked questions.
Click to buy Reputation Management KPI Dashboard in Google Sheets
What Is a Reputation Management KPI Dashboard in Google Sheets?
A Reputation Management KPI Dashboard is a centralized digital system that helps organizations measure and visualize performance indicators linked to public perception, brand sentiment, and customer satisfaction.
By using Google Sheets as the foundation, this dashboard enables users to:
- Track monthly and yearly reputation KPIs,
- Compare actual versus target performance,
- Monitor improvement trends over time,
- Identify problem areas before they affect brand credibility.
Unlike complex reputation management software, this Google Sheets-based dashboard provides a lightweight, transparent, and easy-to-maintain solution suitable for businesses of any size.
Structure of the Dashboard
The Reputation Management KPI Dashboard in Google Sheets consists of six main worksheet tabs, each designed for a specific function. Let’s take a closer look at each one.
⃣ Dashboard Sheet Tab
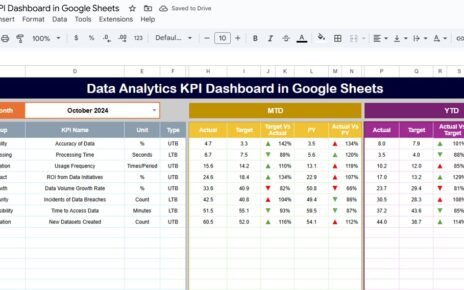
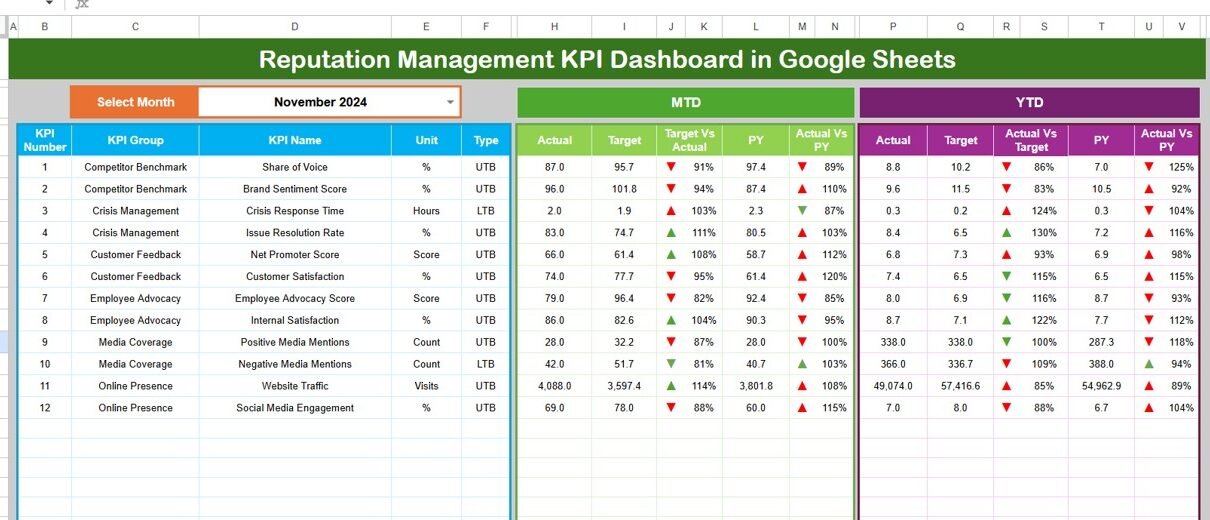
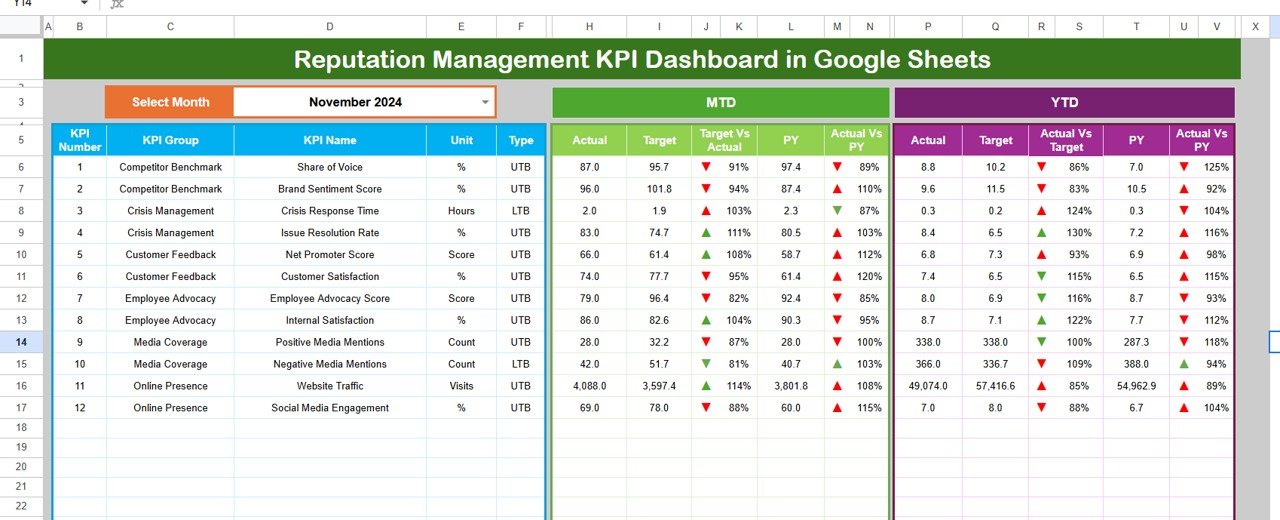
This is the main control center of the dashboard. It displays a summary of all your KPIs in a clean and visual format.
At the top of the sheet, a Month selector (cell D3) allows you to switch between months effortlessly. Once you select a month, all KPI figures — including MTD (Month-to-Date) and YTD (Year-to-Date) values — automatically update to show the correct data.
Each KPI displays:
- Actual performance vs. target
- Comparison with the previous year (PY)
- Conditional formatting arrows showing performance improvement or decline
- Dynamic highlights to instantly reveal metrics that are overperforming or underperforming
This visual design helps teams spot trends quickly and make data-driven decisions with confidence.
Click to buy Reputation Management KPI Dashboard in Google Sheets
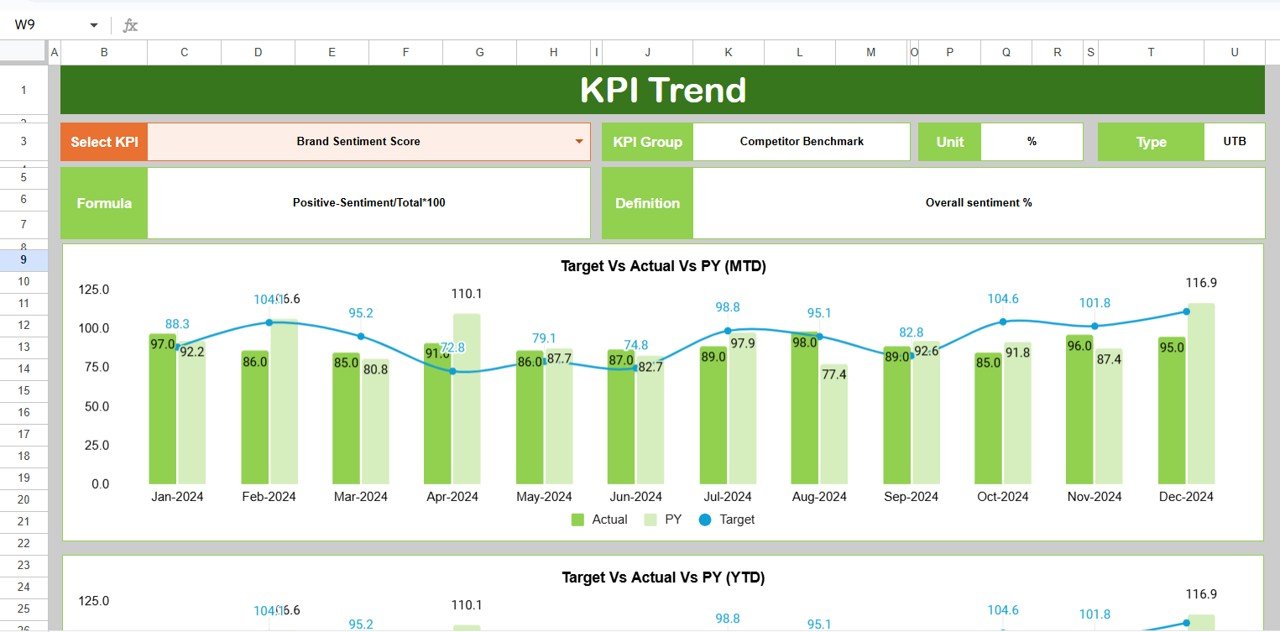
⃣ Trend Sheet Tab
The Trend sheet allows you to analyze KPI performance over time.
A drop-down list (cell C3) lets you choose the specific KPI you want to explore. Once selected, the sheet displays:
- KPI Group
- Unit of Measurement
- KPI Type (e.g., Higher the Better or Lower the Better)
- Formula used
- Detailed definition
Two line charts visualize both MTD and YTD trends for Actual, Target, and Previous Year data. These charts make it easy to identify progress patterns or seasonal fluctuations in reputation performance.
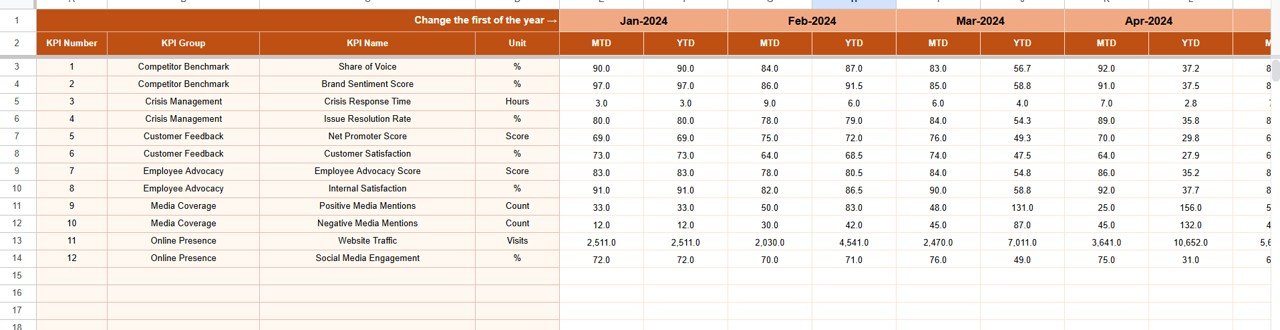
Actual Numbers Input Sheet Tab
This sheet acts as the data entry section for your real-world performance results.
Users can input MTD and YTD Actual Numbers for each month. The month can be modified in cell E1, where you simply set the first month of the year. The rest of the sheet updates automatically.
This structured input design ensures all your data remains consistent, accurate, and ready for visualization on the main dashboard.
Click to buy Reputation Management KPI Dashboard in Google Sheets
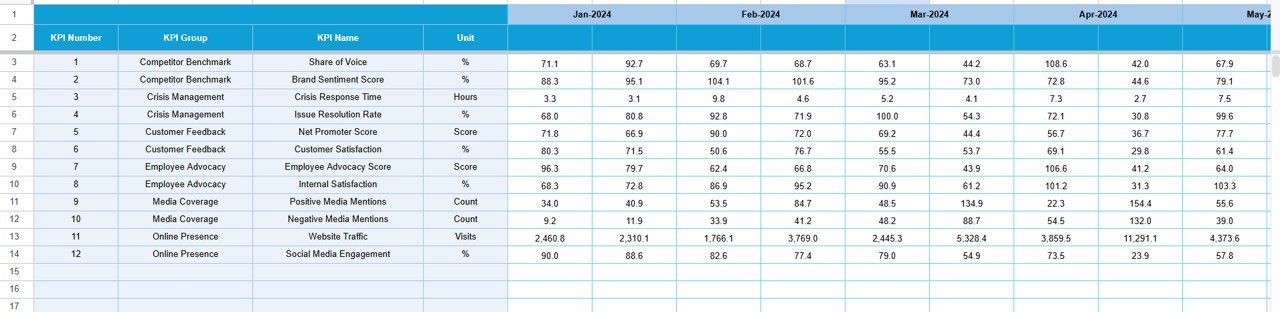
⃣ Target Sheet Tab
Every reputation goal needs a benchmark.
In the Target Sheet, you define your monthly and yearly targets for each KPI. These targets are critical for performance comparison and variance analysis across the dashboard.
By setting realistic and measurable goals, teams can focus their strategies on improving weak areas such as response rate, review management, or overall customer satisfaction.
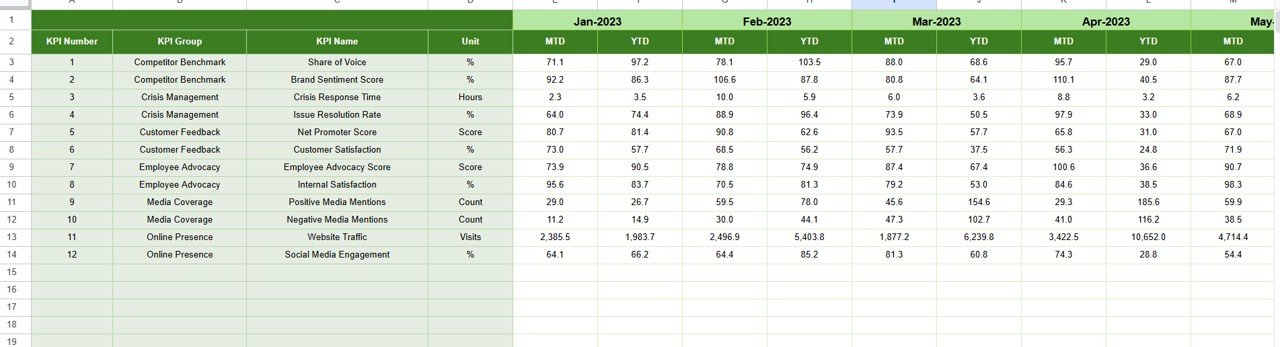
Previous Year Numbers Sheet Tab
This sheet contains the historical data from the previous year. It helps in understanding how the current year’s KPIs compare with past results.
Analyzing year-over-year (YoY) performance allows businesses to measure whether their brand reputation strategies are working effectively over time.
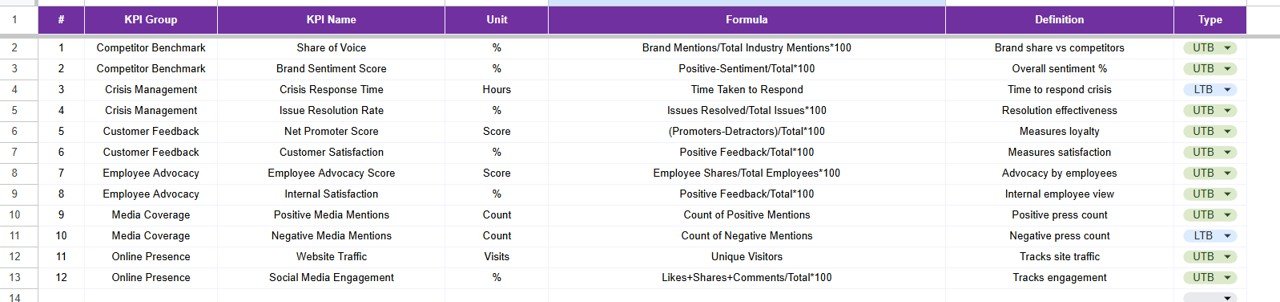
KPI Definition Sheet Tab
Every successful dashboard needs clarity and context.
The KPI Definition Sheet provides detailed descriptions of all metrics being tracked. It includes:
- KPI Name
- KPI Group
- Unit of Measurement
- Formula
- KPI Definition
This sheet is particularly useful for teams to ensure everyone understands how each KPI is calculated and what it represents.
Key Features of the Reputation Management KPI Dashboard
The dashboard is packed with powerful yet easy-to-use features. Below are the standout elements that make it effective for managing and improving your brand reputation.
Dynamic Month Selection
Instantly switch between months to view updated KPI results with automated recalculations.
Visual Performance Indicators
Color-coded conditional formatting arrows make it easy to identify whether a KPI is improving or declining.
MTD and YTD Comparison
The dashboard tracks both Month-to-Date and Year-to-Date performance for all KPIs.
Target vs. Actual vs. Previous Year
Provides side-by-side comparisons that reveal both short-term and long-term performance insights.
Trend Visualization
Interactive line charts display historical performance patterns across key metrics.
Easy Data Input
All data entry sheets are clearly structured, reducing errors and saving time.
Cloud Collaboration
Built in Google Sheets, the dashboard supports real-time sharing, editing, and commenting across teams.
Why Reputation Management Matters
Reputation is the foundation of trust. In today’s digital environment, consumers rely heavily on online reviews, social media comments, and peer recommendations before making a purchase decision.
A strong reputation leads to:
- Higher customer loyalty
- Increased brand credibility
- Better conversion rates
- Reduced marketing costs
On the other hand, poor reputation management can result in negative publicity, loss of customers, and declining revenue. That’s why continuous monitoring through KPIs is essential to maintain brand health.
Top KPIs to Track in Reputation Management
Here are some of the most important KPIs you can include in your dashboard:
- Average Review Rating: Monitors the overall quality of customer reviews.
- Customer Sentiment Score: Measures public perception using positive, neutral, or negative mentions.
- Response Rate: Tracks how quickly and frequently the team responds to feedback.
- Resolution Time: Calculates how fast customer issues are resolved.
- Brand Mentions: Counts how often your brand appears online or in media.
- Net Promoter Score (NPS): Assesses customer loyalty and likelihood to recommend your brand.
- Engagement Rate: Analyzes how users interact with your content on social platforms.
These KPIs provide a complete picture of your organization’s reputation health.
Advantages of Using the Reputation Management KPI Dashboard
- Centralized Performance View
The dashboard consolidates all reputation-related KPIs into one place, making performance monitoring efficient and transparent.
- Data-Driven Decision Making
With accurate trend visualization and comparison features, managers can make smarter strategic decisions.
- Real-Time Collaboration
Since it’s built in Google Sheets, multiple users can update or review data simultaneously from anywhere.
- Customizable and Scalable
You can easily modify KPIs, charts, or targets as your organization grows or changes focus.
- Visual Insights for Quick Action
Color-coded visuals highlight which KPIs need attention, allowing teams to act immediately.
- Time-Saving Automation
Automatic updates and formulas reduce manual work, freeing up time for strategy and improvement.
How to Use the Dashboard Effectively
- Start with KPI Definition:
Ensure all KPIs are clearly defined and understood by the team. - Input Accurate Data:
Regularly update actual numbers for MTD and YTD in the respective sheets. - Review Monthly Trends:
Use the trend chart to identify improvement areas or recurring issues. - Compare with Targets:
Evaluate performance against monthly and yearly goals to understand success rates. - Collaborate and Discuss:
Share insights with stakeholders to align on strategies for improvement. - Refine KPIs as Needed:
Update KPI definitions and targets periodically to stay relevant.
Best Practices for the Reputation Management KPI Dashboard
- Maintain Consistent Data Entry
Always use consistent formats for months, units, and KPI names to avoid errors.
- Set Realistic Targets
Define achievable goals that encourage improvement without creating pressure.
- Review Historical Data
Use the previous year’s data to identify patterns and assess long-term progress.
- Automate Calculations
Utilize Google Sheets formulas for accuracy and reduce manual workload.
- Keep It Visual
Focus on color-coded indicators and charts to communicate insights faster.
- Share Access Securely
Limit editing permissions to authorized users while allowing viewers to access performance reports.
- Refresh Monthly
Regular updates ensure the data remains relevant and useful for management decisions.
Conclusion
The Reputation Management KPI Dashboard in Google Sheets is an essential tool for any organization that values its brand image. It simplifies the complex process of tracking and analyzing reputation metrics, offering a powerful yet easy-to-use solution.
With its structured data input, automated comparisons, and interactive visual insights, businesses can proactively manage their reputation, identify weak spots, and celebrate progress.
Whether you’re a small business monitoring reviews or a large enterprise managing brand sentiment across regions, this dashboard helps you stay informed, responsive, and in control.
Frequently Asked Questions (FAQs)
- What is the purpose of the Reputation Management KPI Dashboard?
It helps organizations monitor and analyze performance indicators related to brand reputation, such as customer satisfaction, sentiment score, and response rate.
- Who can use this dashboard?
It’s ideal for marketing teams, PR departments, social media managers, and customer service units who need real-time reputation insights.
- Can I customize the KPIs in this dashboard?
Yes, you can add, remove, or rename KPIs according to your organization’s goals and data structure.
- How often should I update the dashboard?
It’s best to update it monthly to ensure accurate and timely performance tracking.
- Does the dashboard require any special software?
No. It’s built entirely in Google Sheets, so you only need a Google account to use it.
- What makes this dashboard better than other tools?
It’s cost-effective, fully customizable, and supports real-time team collaboration — unlike many paid reputation management platforms.
- Can small businesses use it?
Absolutely. The dashboard is designed to be scalable and works perfectly for startups, SMEs, and large organizations alike.
Watch the step-by-step video tutorial:
Visit our YouTube channel to learn step-by-step video tutorials
Youtube.com/@NeotechNavigators
Click to buy Reputation Management KPI Dashboard in Google Sheets