Retail success depends heavily on understanding how many customers walk into your store, when they visit, and how their behavior changes over time. However, many retail teams still rely on raw footfall counters or basic spreadsheets, which makes trend analysis slow and inaccurate.Retail Foot Traffic KPI Dashboard in Google Sheets
This is exactly where a Retail Foot Traffic KPI Dashboard in Google Sheets becomes a powerful solution.
This ready-to-use KPI dashboard helps retail managers, store owners, and operations teams track foot traffic performance, compare targets vs actuals, analyze trends, and make data-driven decisions—all in one Google Sheets file.Retail Foot Traffic KPI Dashboard in Google Sheets
In this article, we explain the dashboard structure, worksheet flow, complete KPI list with formulas, and best practices for retail foot traffic analysis.Retail Foot Traffic KPI Dashboard in Google Sheets
What Is a Retail Foot Traffic KPI Dashboard in Google Sheets?
A Retail Foot Traffic KPI Dashboard is a performance monitoring tool designed to measure and analyze customer visits to retail stores. It tracks daily, monthly, and yearly foot traffic and compares performance against targets and previous year data.Retail Foot Traffic KPI Dashboard in Google Sheets
Because the dashboard is built in Google Sheets, it offers:
-
Centralized KPI tracking
-
Real-time collaboration
-
Automatic calculations
-
Visual performance indicators
-
No need for expensive BI tools
This dashboard suits retail store managers, retail operations teams, regional managers, and business owners.Retail Foot Traffic KPI Dashboard in Google Sheets
Key Features of the Retail Foot Traffic KPI Dashboard
Click to Buy Retail Foot Traffic KPI Dashboard in Google Sheets
The dashboard includes 6 structured worksheet tabs, each designed for accurate KPI tracking and analysis.
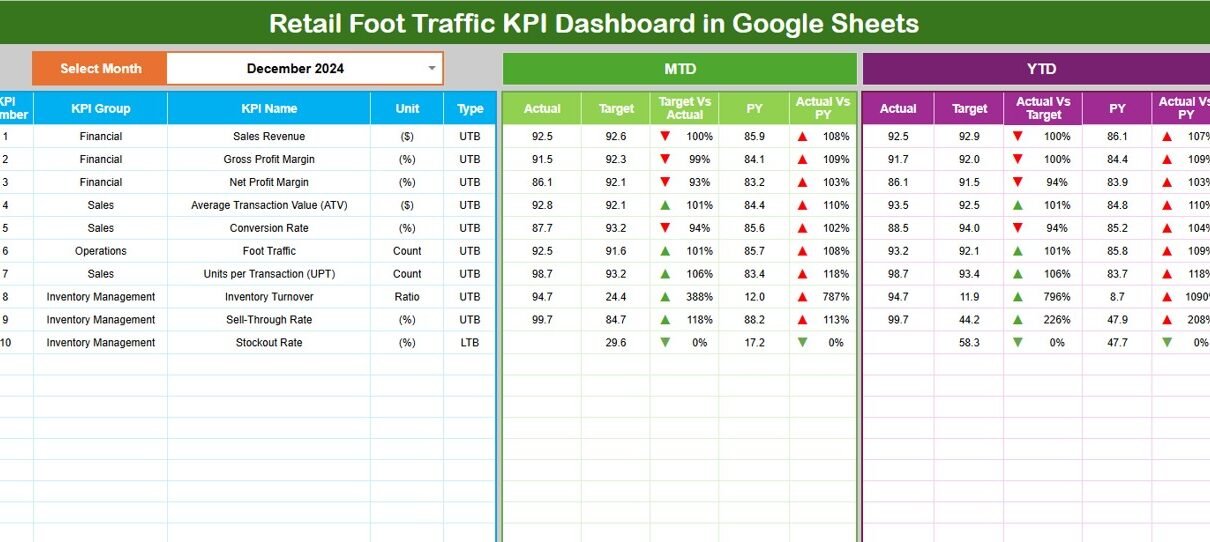
Dashboard Sheet Tab (Main Dashboard)
The Dashboard Sheet provides a consolidated view of all foot traffic KPIs.
-
Select the month from the dropdown in cell D3
-
All KPIs automatically update for the selected month
Metrics Displayed
MTD (Month-to-Date)
-
Actual
-
Target
-
Previous Year
-
Target vs Actual
-
Previous Year vs Actual
YTD (Year-to-Date)
-
Actual
-
Target
-
Previous Year
-
Target vs Actual
-
Previous Year vs Actual
Conditional formatting with up and down arrows clearly highlights performance improvement or decline.

Click to Buy Retail Foot Traffic KPI Dashboard in Google Sheets
KPI Trend Sheet Tab
The KPI Trend Sheet helps analyze individual KPI behavior over time.
-
Select the KPI name from the dropdown in cell C3
The sheet displays:
-
KPI Group
-
Unit of Measurement
-
KPI Type (Lower the Better / Upper the Better)
-
KPI Formula
-
KPI Definition
It also shows month-wise trends for deeper insights.

Click to Buy Retail Foot Traffic KPI Dashboard in Google Sheets
Actual Number Sheet Tab
This sheet stores actual foot traffic data.
-
Select the first month of the year in cell E1
-
Enter MTD and YTD actual values for each KPI
All dashboard values update automatically.

Click to Buy Retail Foot Traffic KPI Dashboard in Google Sheets
Target Sheet Tab
The Target Sheet stores foot traffic goals.
-
Monthly (MTD) targets
-
Annual (YTD) targets
Targets help retail teams align store traffic goals with business plans.

Previous Year Number Sheet Tab
This sheet stores last year’s foot traffic data.
It enables:
-
Year-over-year comparison
-
Seasonal trend analysis
-
Performance benchmarking

Click to Buy Retail Foot Traffic KPI Dashboard in Google Sheets
KPI Definition Sheet Tab
The KPI Definition Sheet ensures KPI clarity and consistency.
It includes:
-
KPI Name
-
KPI Group
-
Unit
-
Formula
-
KPI Definition
-
KPI Type (UTB / LTB)
This sheet acts as a KPI reference guide

Advantages of Retail Foot Traffic KPI Dashboard
Click to Buy Retail Foot Traffic KPI Dashboard in Google Sheets
-
Centralized foot traffic monitoring
-
Clear target vs actual comparison
-
Seasonal and trend visibility
-
Improved store staffing decisions
-
Better marketing campaign evaluation
-
Cost-effective Google Sheets solution
Opportunities for Improvement in Foot Traffic Analysis
-
Integrate POS sales data
-
Add campaign-wise traffic tracking
-
Track weather impact on visits
-
Analyze day-of-week patterns
-
Add store heatmap analysis
-
Automate sensor data imports
Best Practices for Using the Dashboard
Click to Buy Retail Foot Traffic KPI Dashboard in Google Sheets
-
Update foot traffic data daily
-
Set realistic monthly targets
-
Review trends weekly
-
Compare YoY data regularly
-
Share insights with store managers
-
Maintain consistent data definitions
Conclusion
A Retail Foot Traffic KPI Dashboard in Google Sheets provides retail teams with a clear, structured, and visual way to track customer visits and store performance. By combining MTD, YTD, targets, and historical comparisons, the dashboard delivers actionable insights without complexity. Because it runs in Google Sheets, teams can collaborate easily and scale analysis as business grows.
For retailers focused on improving store performance and customer engagement, this dashboard becomes an essential analytics tool.
Frequently Asked Questions (FAQs)
1. Who should use this dashboard?
Retail store managers, operations teams, and business owners.
2. Can it handle multiple stores?
Yes, with proper store-level data.
3. Is the dashboard customizable?
Yes, all KPIs, targets, and charts are editable.
4. Does it support year-over-year comparison?
Yes, through the Previous Year sheet.
5. Is Google Sheets secure?
Yes, with role-based access permissions.
6. Does it require technical skills?
No, basic Google Sheets knowledge is enough.
Visit our YouTube channel to learn step-by-step video tutorials
Youtube.com/@NeotechNavigators
Watch the step-by-step video tutorial:
Click to Buy Retail Foot Traffic KPI Dashboard in Google Sheets