The Ride-Sharing KPI Dashboard in Google Sheets is a powerful analytics tool designed to help ride-hailing and transport companies monitor business performance across drivers, riders, revenue, and service quality — all in one centralized system.
This ready-to-use Google Sheets template enables you to measure performance through dynamic KPIs, interactive charts, and automated calculations, helping you make better, data-driven decisions.
What Is a Ride-Sharing KPI Dashboard in Google Sheets?
A Ride-Sharing KPI Dashboard is a data visualization and performance tracking system built in Google Sheets that provides real-time insights into ride-sharing operations.
It helps companies track key business metrics such as:
-
Total rides completed
-
Average fare value
-
Driver performance
-
Customer satisfaction
-
On-time arrivals
-
Cancellation rates
With built-in automation, conditional formatting, and dropdown-driven navigation, this dashboard is both user-friendly and analytically powerful.
Structure of the Dashboard
Click to Buy Ride-Sharing KPI Dashboard in Google Sheets
The Ride-Sharing KPI Dashboard in Google Sheets consists of six worksheets, each designed for a specific analytical or data-entry purpose.
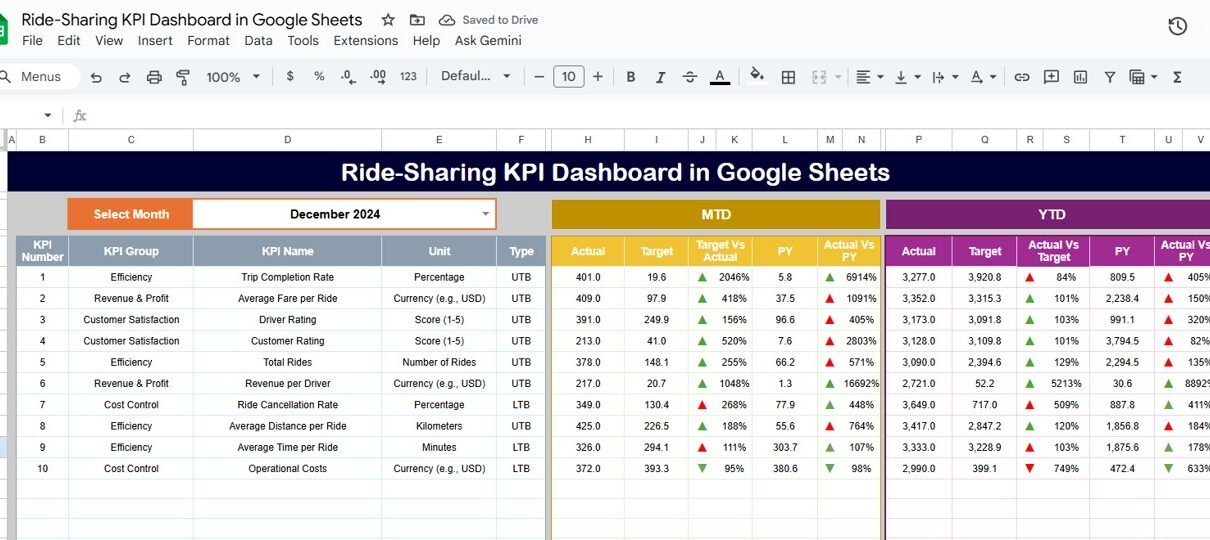
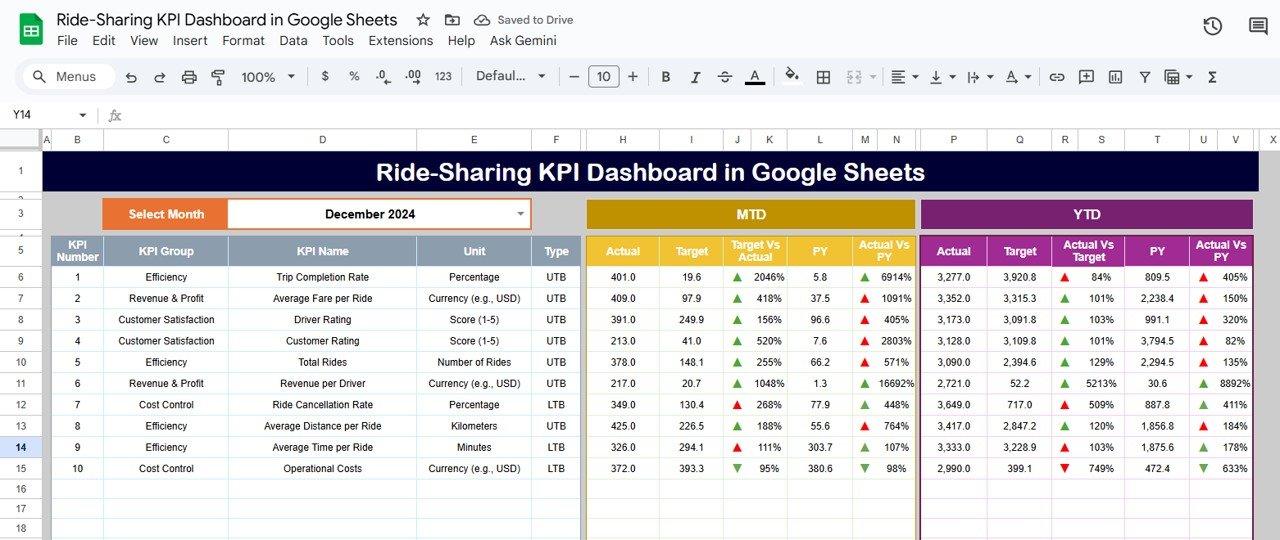
Dashboard Sheet Tab
This is the main dashboard sheet, where all KPIs and performance visuals are displayed.
Key Features:
-
Month Selection (Cell D3): Choose any month from a dropdown menu to view monthly data dynamically.
-
Automatic Updates: When the month changes, all MTD (Month-to-Date) and YTD (Year-to-Date) values update automatically.
Visual Comparisons:
- MTD Actual vs Target
- MTD Actual vs Previous Year
- YTD Actual vs Target
- YTD Actual vs Previous Year
Conditional Formatting: Up/down arrows and color-coded indicators (green/red) show performance trends.
This allows managers to identify operational strengths and weaknesses at a glance.
Click to Buy Ride-Sharing KPI Dashboard in Google Sheets
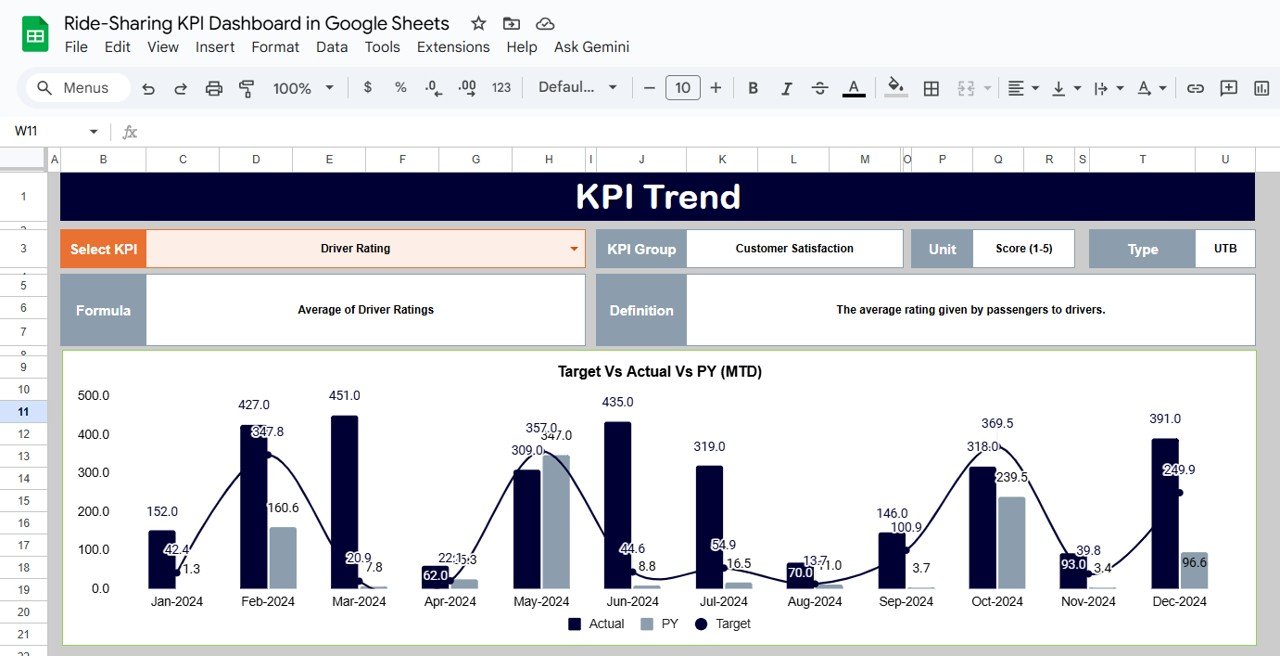
KPI Trend Sheet Tab
This sheet lets you explore the historical performance of any KPI over time.
Features:
Select KPI name from a dropdown (cell C3).
Displays:
KPI Group
- Unit
- Formula
- Definition
- Type (Lower The Better / Upper The Better)
Trend chart showing month-by-month KPI changes.
This helps in identifying long-term performance trends across operations.
Click to Buy Ride-Sharing KPI Dashboard in Google Sheets
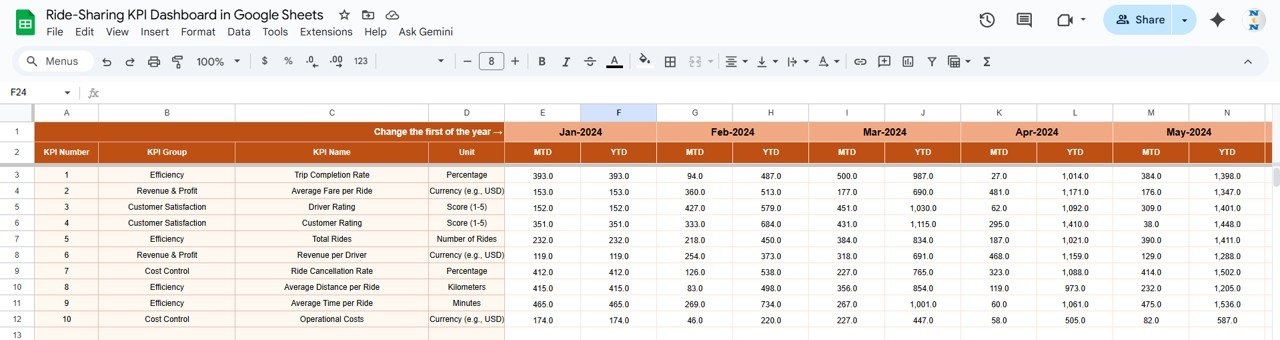
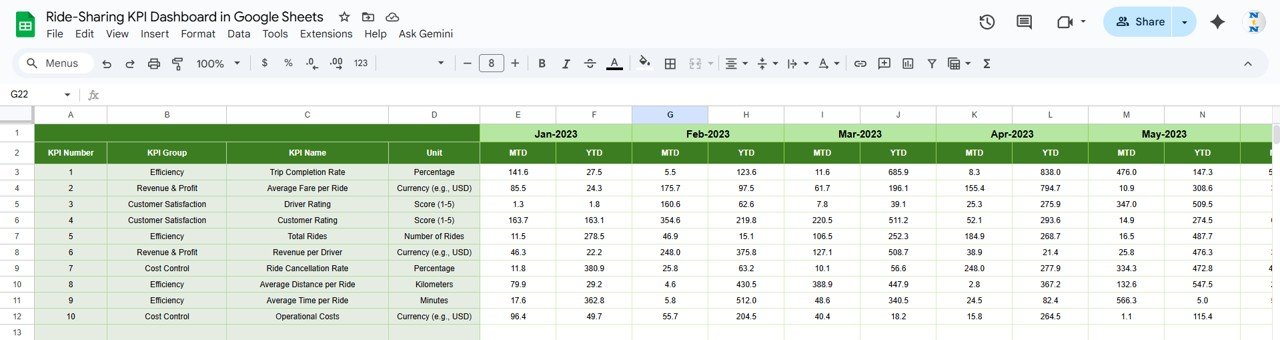
Actual Numbers Sheet Tab
This sheet captures the actual operational data for each month.
-
Input MTD and YTD figures for every KPI.
-
Change the fiscal year start month in cell E1 — this automatically adjusts YTD calculations.
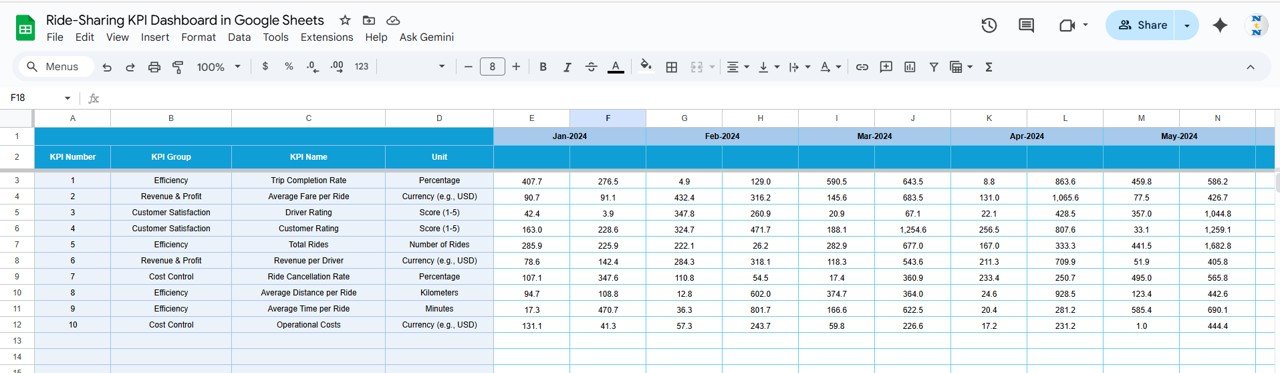
Target Sheet Tab
Enter target values for each KPI per month (both MTD and YTD).
These serve as benchmarks for comparison in the dashboard.
Click to Buy Ride-Sharing KPI Dashboard in Google Sheets
Previous Year Number Sheet Tab
This sheet stores the previous year’s KPI data, enabling automatic year-over-year (YoY) comparisons.
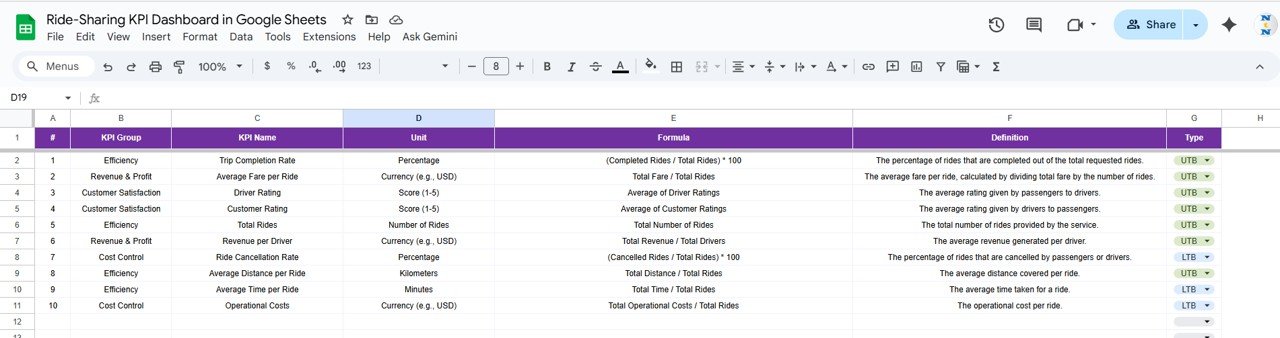
KPI Definition Sheet Tab
This sheet defines all KPIs, including their formulas, aggregation methods, and whether a lower value (LTB) or higher value (UTB) indicates better performance.
Click to Buy Ride-Sharing KPI Dashboard in Google Sheets
Advantages of the Ride-Sharing KPI Dashboard
-
Centralized Analytics: Combines operations, finance, and customer KPIs.
-
Real-Time Monitoring: Automatically updates with each data entry.
-
Visual Storytelling: Conditional formatting highlights key variances instantly.
-
Comparative Analysis: MTD, YTD, Target, and YoY comparisons in one place.
-
Customizable Design: Easily add or modify KPIs and charts.
-
Collaborative Environment: Google Sheets enables real-time multi-user access.
-
No Additional Software: 100% cloud-based and platform-independent.
Opportunities for Improvement
You can enhance this dashboard with additional automation and analytics features:
-
Google Apps Script Integration: Automate data imports from ride logs or APIs.
-
Driver Performance Reports: Add deeper analytics by driver or location.
-
Revenue Forecasting: Use trendline formulas for demand prediction.
-
Geographical Analysis: Incorporate heatmaps by region or city.
-
Customer Segmentation: Analyze repeat vs new user behavior.
Best Practices for Using the Dashboard
Click to Buy Ride-Sharing KPI Dashboard in Google Sheets
-
Keep Data Updated: Input monthly actuals and targets regularly.
-
Verify Data Accuracy: Validate ride and revenue figures for each month.
-
Monitor KPI Trends: Review YoY performance to spot seasonal changes.
-
Protect Core Sheets: Lock formula and KPI definition tabs.
-
Review Monthly: Evaluate underperforming metrics and take corrective actions.
Conclusion
The Ride-Sharing KPI Dashboard in Google Sheets provides ride-hailing and logistics businesses with a robust and easy-to-use platform for monitoring performance.
It simplifies KPI tracking, ensures transparency, and supports data-driven decision-making. Whether you’re managing city-wide operations or regional performance, this dashboard helps align your targets with actual outcomes — all within a collaborative Google Sheets environment.
Frequently Asked Questions (FAQ)
Click to Buy Ride-Sharing KPI Dashboard in Google Sheets
1. Can I track multiple cities or regions?
Yes. Add a “Region” column in the Actuals sheet to segment data by geography.
2. Can I automate ride data imports?
Yes. You can link your CRM or ride management API using Google Apps Script.
3. Can I add driver-level analytics?
Absolutely. Create a separate tab for driver KPIs like ride count, ratings, and cancellations.
4. How often should I update data?
Ideally monthly, but you can also update weekly for near real-time reporting.
5. Can I export reports?
Yes, export your dashboard to PDF for monthly presentations.
Visit our YouTube channel to learn step-by-step video tutorials
Youtube.com/@NeotechNavigators
Watch the step-by-step video Demo: