In the world of business, managing risks is crucial for maintaining stability and ensuring long-term success. A Risk Management KPI Dashboard in Google Sheets serves as an essential tool that allows organizations to monitor, evaluate, and manage various risks in real-time. It helps businesses stay on top of their risk management strategies, making it easier to mitigate potential threats and take proactive measures.
This article delves into how a Risk Management KPI Dashboard works, the KPIs that should be tracked, and how it can be customized in Google Sheets to fit your business needs.
Table of Contents
ToggleWhat is a Risk Management KPI Dashboard?
A Risk Management KPI Dashboard is a tool that aggregates key performance indicators (KPIs) related to risk management within an organization. It enables businesses to monitor the effectiveness of their risk management efforts and track potential risks that could impact the organization’s operations.
Using Google Sheets for creating a Risk Management KPI Dashboard is a cost-effective and user-friendly solution. With real-time updates, easy customization, and collaboration features, it provides the flexibility that businesses need to track and assess their risk management strategies efficiently.
Key Features of the Risk Management KPI Dashboard in Google Sheets
Click to buy Risk Management KPI Dashboard in Google Sheets
The Risk Management KPI Dashboard in Google Sheets is a ready-to-use template that includes six key worksheets designed to track, manage, and evaluate the various risks within your organization. Here’s an overview of each worksheet and how it contributes to the overall dashboard:
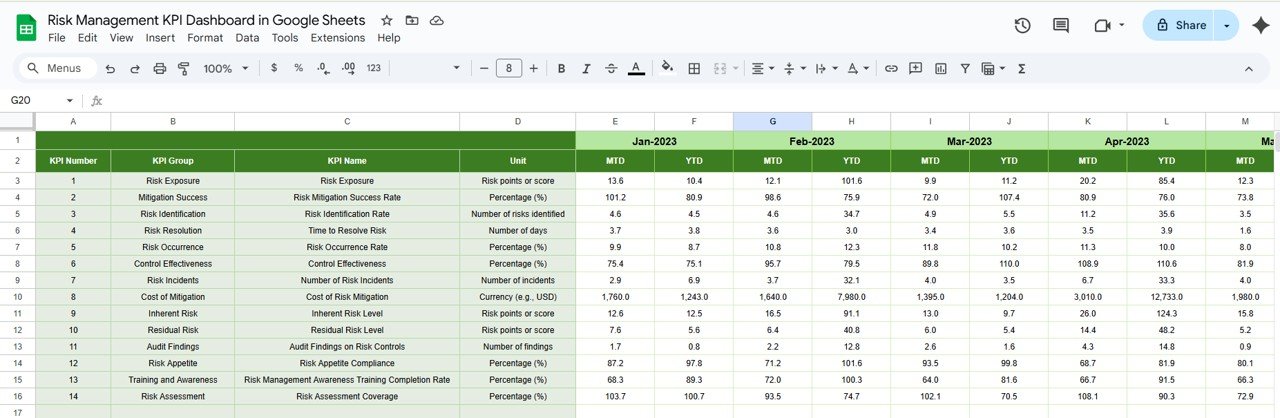
1. Dashboard Sheet Tab
This is the primary sheet in the dashboard where all the key information is displayed. You can select the month from the dropdown in range D3, and the entire dashboard will update accordingly, reflecting data for the selected month.
Key elements displayed include:
- MTD (Month-to-Date) Actuals: Actual performance data for the current month.
- Target vs Actual: Comparison of actual performance against set targets.
- Previous Year Data (PY): A comparison of current data with the same period from the previous year.
- YTD (Year-to-Date) Actuals: Cumulative performance data for the entire year.
- Conditional formatting (up/down arrows) is used to visually represent performance trends.

Click to buy Risk Management KPI Dashboard in Google Sheets
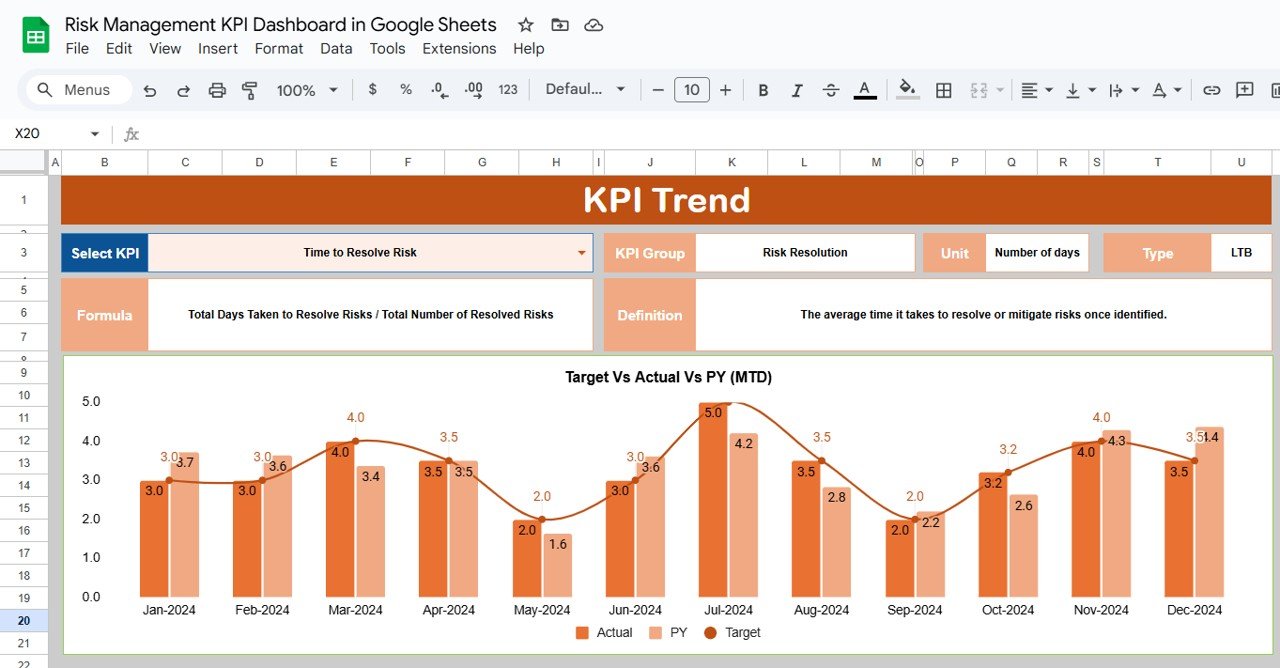
2. KPI Trend Sheet Tab
In this sheet, users can select the KPI name from a dropdown (range C3). For each selected KPI, the following details are shown:
- KPI Group: The category under which the KPI falls.
- Unit of Measurement: The unit in which the KPI is measured (e.g., percentage, dollar amount, etc.).
- Type of KPI: Whether the KPI is “Lower the Better” or “Upper the Better.”
- Formula of the KPI: The formula used to calculate the KPI.
- Definition of the KPI: A clear description of what the KPI measures and why it is important for risk management.
Click to buy Risk Management KPI Dashboard in Google Sheets
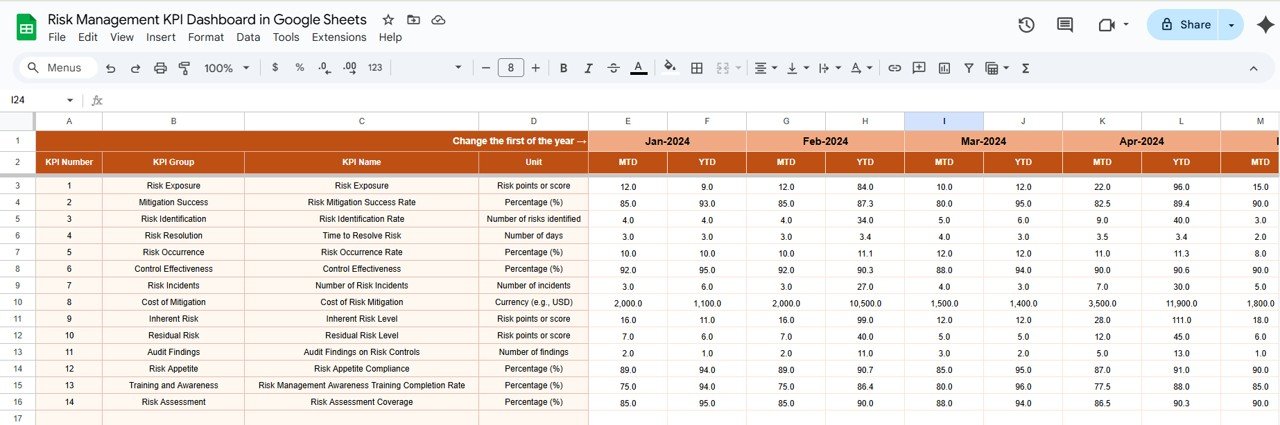
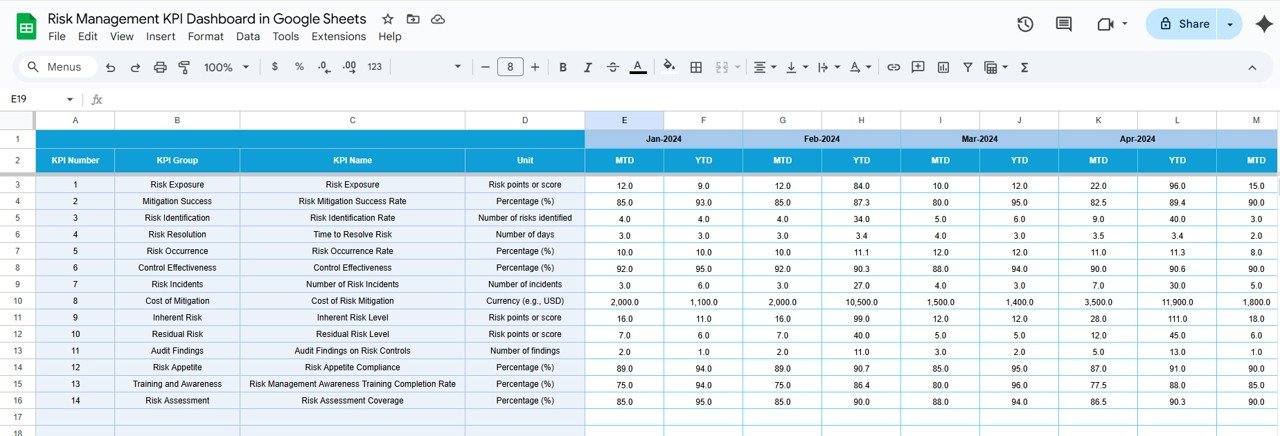
3. Actual Numbers Sheet Tab
This sheet allows you to input the actual values for YTD and MTD compliance. You can change the month in range E1, making it easy to track performance for specific periods.
4. Target Sheet Tab
Here, users can enter the target numbers for each KPI, both for MTD and YTD. This allows businesses to compare their actual performance against the predetermined targets.
Click to buy Risk Management KPI Dashboard in Google Sheets
5. Previous Year Numbers Sheet Tab
This sheet contains the actual performance numbers from the previous year, allowing for year-over-year comparisons. It helps to track the progress and improvement in risk management over time.
Click to buy Risk Management KPI Dashboard in Google Sheets
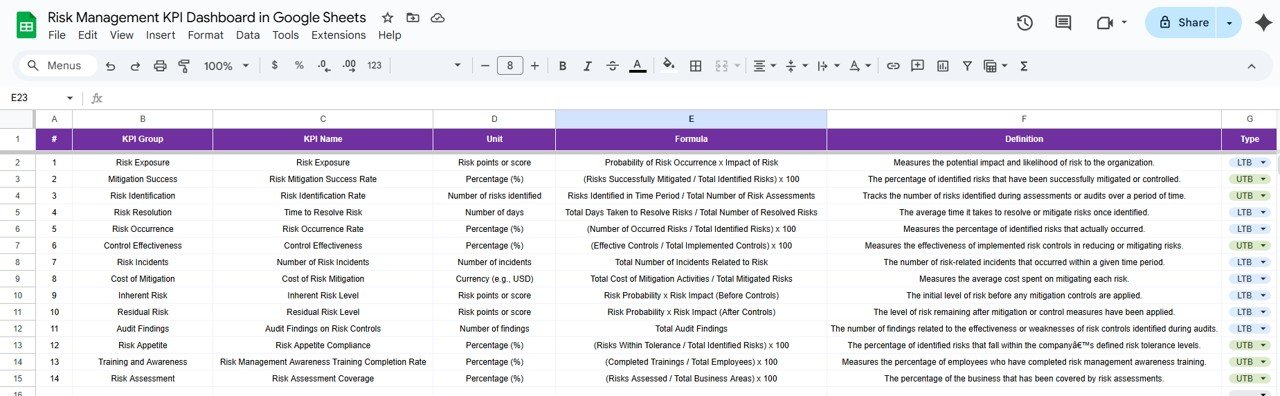
6. KPI Definition Sheet Tab
This sheet provides an organized space to input detailed information about each KPI. It includes:
- KPI Name
- KPI Group
- Unit of Measurement
- Formula
- KPI Definition
Advantages of Using a Risk Management KPI Dashboard in Google Sheets
Implementing a Risk Management KPI Dashboard offers a wide range of advantages that can help organizations streamline their risk management processes:
- Centralized Risk Data: The dashboard provides a centralized location for all risk-related data. It eliminates the need for multiple systems or spreadsheets, making it easier to access, track, and manage risk data.
- Real-Time Monitoring: Google Sheets enables real-time updates. As soon as data is inputted or modified, the dashboard reflects those changes, providing up-to-date insights on risk management.
- Collaboration and Accessibility: Being cloud-based, Google Sheets allows teams to collaborate seamlessly. Multiple users can work on the dashboard at the same time, ensuring that all stakeholders have access to the latest data.
- Cost-Effective Solution: Google Sheets is free to use, making it a cost-effective solution for businesses of all sizes. It eliminates the need for expensive risk management software while still offering powerful features.
- Customizability: The dashboard is highly customizable. You can add or remove KPIs, adjust formulas, and modify the layout to meet the unique needs of your organization’s risk management strategy.
Opportunities for Improvement in the Risk Management KPI Dashboard
Click to buy Risk Management KPI Dashboard in Google Sheets
While the Risk Management KPI Dashboard in Google Sheets offers great features, there are always opportunities for improvement:
- Automation of Data Entry: Manual data entry can be time-consuming and prone to errors. Automating data imports or integrating with other business systems (e.g., risk management software) would streamline the process and ensure more accurate data.
- Advanced Data Analytics: Google Sheets offers basic analysis capabilities, but incorporating advanced analytics such as predictive modeling, trend analysis, or machine learning could further improve the effectiveness of the dashboard.
- Enhanced Visualizations: While Google Sheets provides basic charting, improving data visualization with more interactive and dynamic charts could help users quickly interpret complex risk data.
- Advanced Security Features: Enhancing the dashboard with more robust security features, such as user-specific access permissions or encrypted data entry, would improve the protection of sensitive risk information.
Best Practices for Using a Risk Management KPI Dashboard
To maximize the effectiveness of the Risk Management KPI Dashboard, consider following these best practices:
- Regularly Update Data: It’s crucial to update the data frequently to ensure that the dashboard accurately reflects the current state of risk management efforts.
- Set Realistic Targets: Set achievable and realistic risk management targets based on historical data and industry benchmarks. Regularly review these targets and adjust them as needed.
- Monitor KPIs Consistently: Regularly monitor the KPIs and use the insights to adjust your risk management strategy as needed. This helps ensure that potential risks are addressed proactively.
- Train Your Team: Provide training to your team on how to use the Risk Management KPI Dashboard effectively. This ensures that everyone understands the KPIs, data entry process, and how to interpret the results.
- Leverage Conditional Formatting: Use conditional formatting to highlight critical issues or risks that require immediate attention, making it easy to spot trends and take action.
Conclusion
Click to buy Risk Management KPI Dashboard in Google Sheets
A Risk Management KPI Dashboard in Google Sheets is an invaluable tool for businesses looking to track, manage, and reduce risks. By monitoring key performance indicators in real-time, businesses can make informed decisions, mitigate potential threats, and improve overall risk management strategies. The template offers ease of use, customization, and collaboration, all while being a cost-effective solution.
With a comprehensive set of KPIs, real-time updates, and a user-friendly interface, the Risk Management KPI Dashboard can help businesses stay ahead of risks, ensuring that they are always prepared for the future.
Frequently Asked Questions (FAQs)
1. What is a Risk Management KPI Dashboard?
A Risk Management KPI Dashboard is a tool used to track and monitor key performance indicators related to risk management within an organization.
2. How do I enter data into the Risk Management KPI Dashboard?
Data can be entered into various sheets such as the “Actual Numbers” sheet for real-time updates, the “Target” sheet for predefined goals, and the “Previous Year” sheet for historical comparisons.
3. Can I customize the KPIs in the Google Sheets dashboard?
Yes, the dashboard is fully customizable. You can add or remove KPIs, adjust formulas, and modify the layout according to your business needs.
4. Is the Risk Management KPI Dashboard in Google Sheets free?
Yes, Google Sheets is a free tool, making it an affordable solution for businesses to track their risk management performance.
5. How often should the Risk Management KPI Dashboard be updated?
It is recommended to update the dashboard regularly, ideally on a monthly or quarterly basis, depending on the frequency of risk data changes in your organization.