In the fast-paced world of SaaS (Software as a Service) businesses, tracking key performance indicators (KPIs) is crucial for sustained growth and success. The SaaS Business KPI Dashboard in Google Sheets is a powerful tool designed to help businesses monitor and measure their key metrics, such as monthly recurring revenue (MRR), customer retention, and churn rates. This dashboard helps organizations visualize data and make informed decisions, ensuring business objectives are met.
In this article, we’ll explain the features of the SaaS Business KPI Dashboard in Google Sheets, the KPIs it tracks, and how it can help improve performance.
What is the SaaS Business KPI Dashboard in Google Sheets?
The SaaS Business KPI Dashboard in Google Sheets is a ready-to-use template that allows SaaS companies to track their key performance metrics. The dashboard is customizable and allows businesses to input actual and target values, monitor performance, and visualize trends over time. It’s an essential tool for SaaS leaders, as it provides actionable insights into business performance and helps drive decision-making processes.
With this template, companies can track critical KPIs like customer acquisition cost (CAC), lifetime value (LTV), and churn rates in one place.
Key Features of the SaaS Business KPI Dashboard
The SaaS Business KPI Dashboard includes six essential worksheets that provide detailed insights into different aspects of your SaaS business. Let’s break down each worksheet:
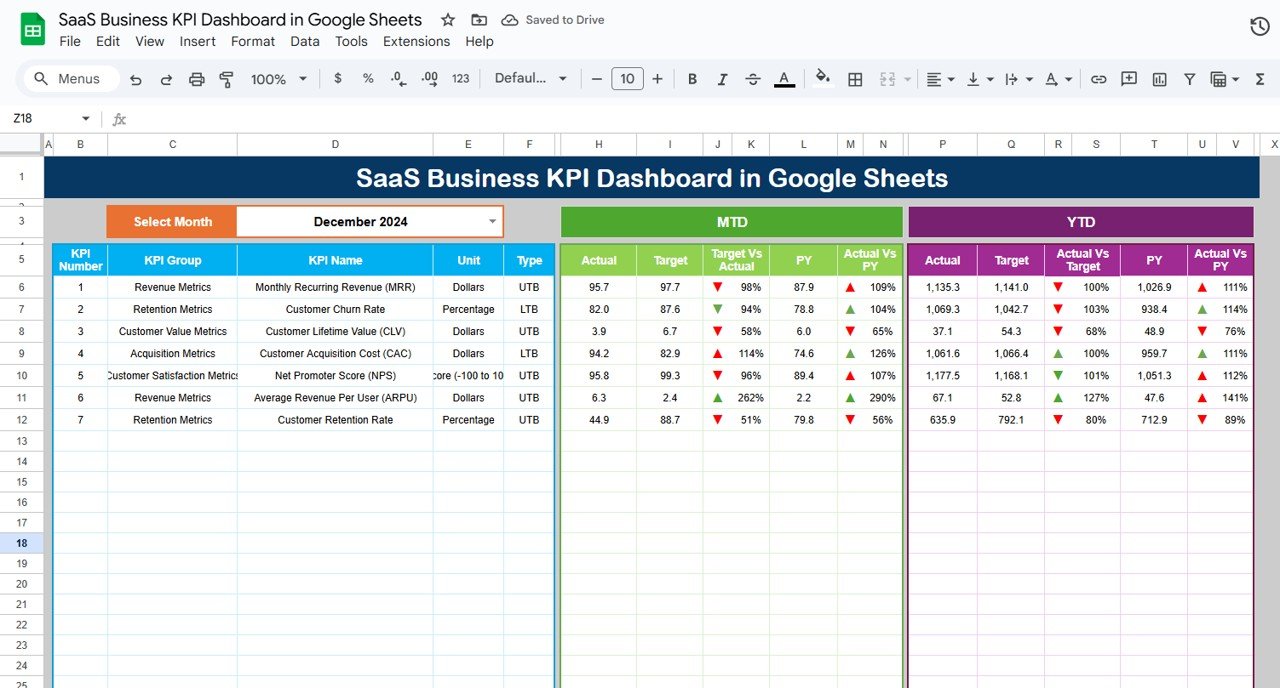
1. Dashboard Sheet Tab
The Dashboard Sheet is the main overview tab where all KPIs are displayed for quick and easy monitoring.
Month Selection (D3): Select the month from the dropdown to change the data across the entire dashboard.
Key Metrics:
- MTD Actual, Target, Previous Year Data: Track performance against the target for the month and compare it with previous year data.
- YTD Actual, Target, Previous Year Data: Monitor year-to-date performance and compare it to your annual goals and last year’s data.
-
Conditional Formatting: Arrows (up or down) highlight whether the KPIs are on track or falling short, giving you a quick visual cue
.Click to buy SaaS Business KPI Dashboard in Google Sheets
2. KPI Trend Sheet Tab
The KPI Trend Sheet helps you track and visualize the performance of selected KPIs over time.
-
KPI Selection (C3): Choose the KPI you want to analyze from a dropdown list.
-
KPI Group, Unit, and Type: Displays the group of the KPI (e.g., financials, customer metrics), the unit of measurement (e.g., dollars, percentages), and whether the KPI is “Lower the Better” (LTB) or “Upper the Better” (UTB).
-
Formula and Definition: Understand the formula behind each KPI and its significance in the context of your SaaS business.

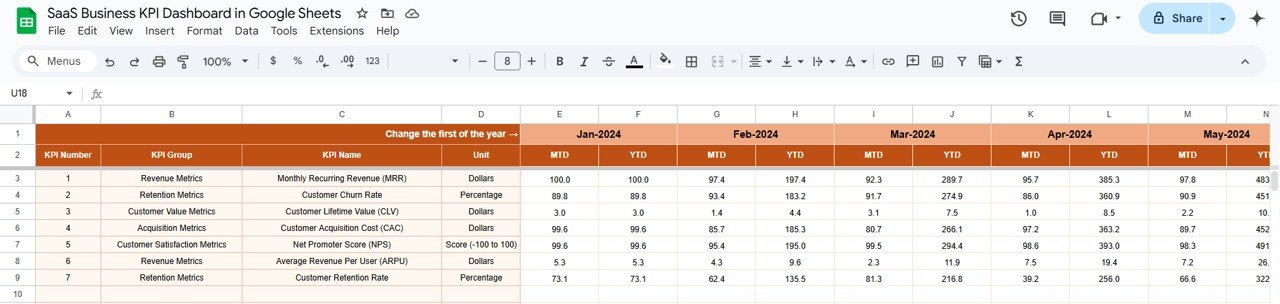
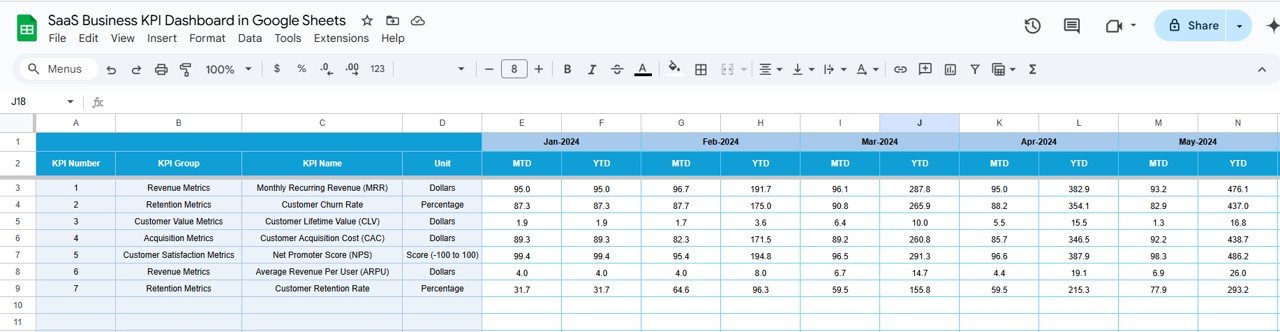
3. Actual Numbers Sheet Tab
This sheet allows you to input actual performance data for each KPI.
-
MTD and YTD Data: Enter the actual values for the month-to-date (MTD) and year-to-date (YTD). These figures will automatically update the dashboard.
-
Month Selection (E1): Choose the starting month of the year to update the dashboard with the relevant data.
.Click to buy SaaS Business KPI Dashboard in Google Sheets
4. Target Sheet Tab
The Target Sheet is where you enter your target values for each KPI.
-
Monthly and YTD Targets: Enter the target values for each KPI for the selected month and year-to-date.
-
Target Comparison: The dashboard will compare the actual figures to the targets, highlighting areas that require attention.
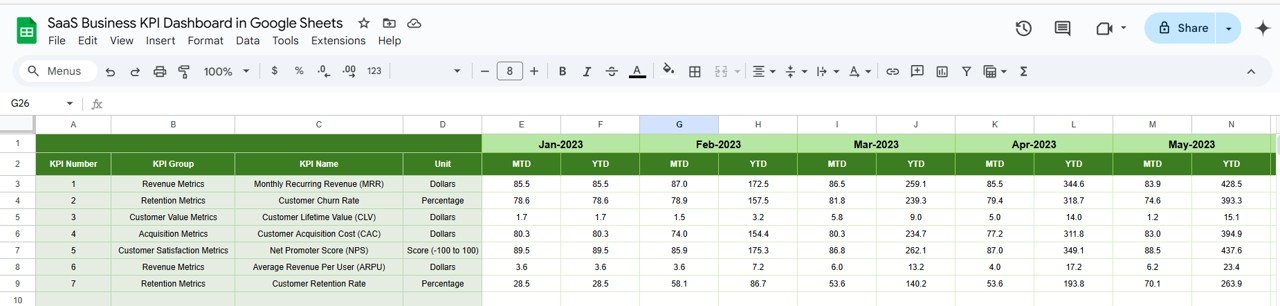
5. Previous Year Numbers Sheet Tab
This sheet allows you to track historical performance.
-
Last Year’s Data: Enter the previous year’s data to compare current performance with the same period last year.
.Click to buy SaaS Business KPI Dashboard in Google Sheets
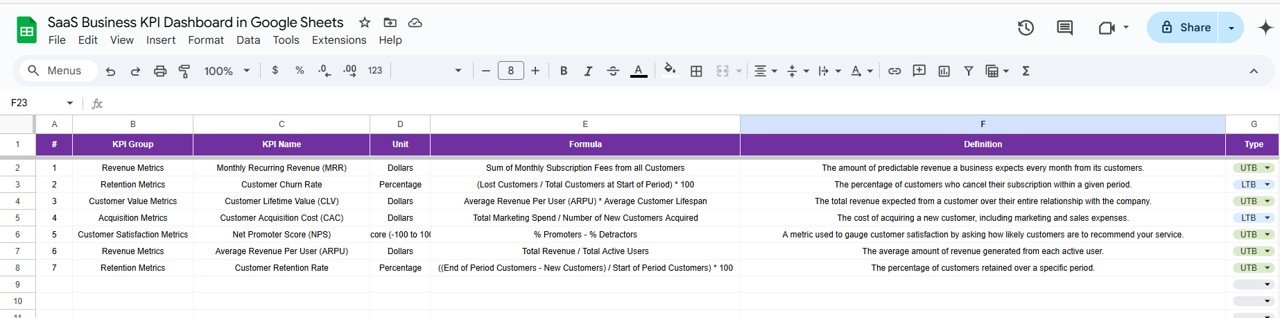
6. KPI Definition Sheet Tab
This sheet provides a detailed explanation of each KPI.
-
KPI Name, Group, Unit: Includes the name, group, and unit of each KPI.
-
Formula and Definition: The formula behind each KPI is explained here, along with its definition to clarify its significance.
Advantages of Using the SaaS Business KPI Dashboard
The SaaS Business KPI Dashboard offers several key benefits to help manage your SaaS business:
-
Comprehensive Tracking: Track all key metrics in one place, including revenue, churn, and customer satisfaction.
-
Real-Time Insights: Update the dashboard regularly to get real-time insights into the health of your business.
-
Data-Driven Decisions: Make informed decisions based on actual performance compared to targets and historical data.
-
Visual Representation: The dashboard provides visual charts and indicators that make it easy to interpret complex data at a glance.
-
Customization: Customize the dashboard to suit the specific needs of your SaaS business by adding or removing KPIs.
Opportunity for Improvement in the SaaS Business KPI Dashboard
.Click to buy SaaS Business KPI Dashboard in Google Sheets
While the SaaS Business KPI Dashboard is a valuable tool, there are opportunities for further enhancement:
-
Automated Data Import: Integrate the dashboard with your CRM or sales software to automate data entry and keep it up-to-date.
-
Advanced Analytics: Incorporating machine learning algorithms could help predict churn, revenue growth, and customer behavior trends.
-
Mobile-Friendly Version: Developing a mobile version of the dashboard would allow managers to access insights on the go.
-
Predictive Metrics: Including forecasting features would help predict future KPIs and guide decision-making.
Best Practices for Using the SaaS Business KPI Dashboard
To make the most of the SaaS Business KPI Dashboard, follow these best practices:
-
Update Regularly: Ensure your data is always up-to-date to track real-time performance and adjust strategies quickly.
-
Set Realistic Targets: Align your KPIs with your business goals to ensure that targets are achievable and actionable.
-
Monitor Trends: Regularly review your KPIs to identify trends and patterns, allowing for proactive decision-making.
-
Collaborate Across Teams: Share the dashboard with relevant teams (sales, marketing, customer success) to align efforts and improve overall performance.
-
Leverage Data Insights: Use the data from the dashboard to continuously improve processes, reduce churn, and drive growth.
Conclusion’
.Click to buy SaaS Business KPI Dashboard in Google Sheets
The SaaS Business KPI Dashboard in Google Sheets is an essential tool for tracking key performance metrics in a SaaS business. By visualizing data related to revenue growth, customer retention, and operational efficiency, the dashboard empowers businesses to make data-driven decisions and optimize their operations. With real-time insights and customizable features, it is a valuable resource for SaaS leaders looking to improve business performance and drive sustainable growth.
Frequently Asked Questions (FAQs)
1. What KPIs are tracked in the SaaS Business KPI Dashboard?
The dashboard tracks KPIs such as MRR, customer churn rate, LTV, CAC, and net revenue retention.
2. Can I customize the SaaS Business KPI Dashboard?
Yes, the dashboard is fully customizable. You can add, remove, or modify KPIs based on your business needs.
3. How do I update the SaaS Business KPI Dashboard?
Simply input your actual performance data in the Actual Numbers Sheet and set targets in the Target Sheet to keep the dashboard updated.
4. Can I integrate the dashboard with other tools?
Yes, the dashboard can be integrated with your CRM or financial software to automate data entry and improve tracking accuracy.
5. How often should I update the SaaS Business KPI Dashboard?
It’s recommended to update the dashboard regularly, especially at the end of each month or quarter, to monitor progress and performance.
Visit our YouTube channel to learn step-by-step video tutorials
Youtube.com/@NeotechNavigators
Watch the step-by-step video Demo: