Sales performance is crucial for any business, and tracking key metrics can make or break a company’s success. One of the most effective ways to monitor and manage sales performance is by using a Sales KPI Dashboard in Google Sheets. This dashboard allows teams to track critical sales KPIs, compare actual data against targets, and make informed decisions to improve sales performance. In this article, we will explore how to create a Sales KPI Dashboard in Google Sheets, discuss various KPIs you should track, and guide you through using the template effectively.
Key Features of the Sales KPI Dashboard in Google Sheets
This Sales KPI Dashboard template in Google Sheets is a ready-to-use tool designed to help businesses track and analyze their sales data. Below are the key features of this comprehensive dashboard:
1. Dashboard Sheet Tab
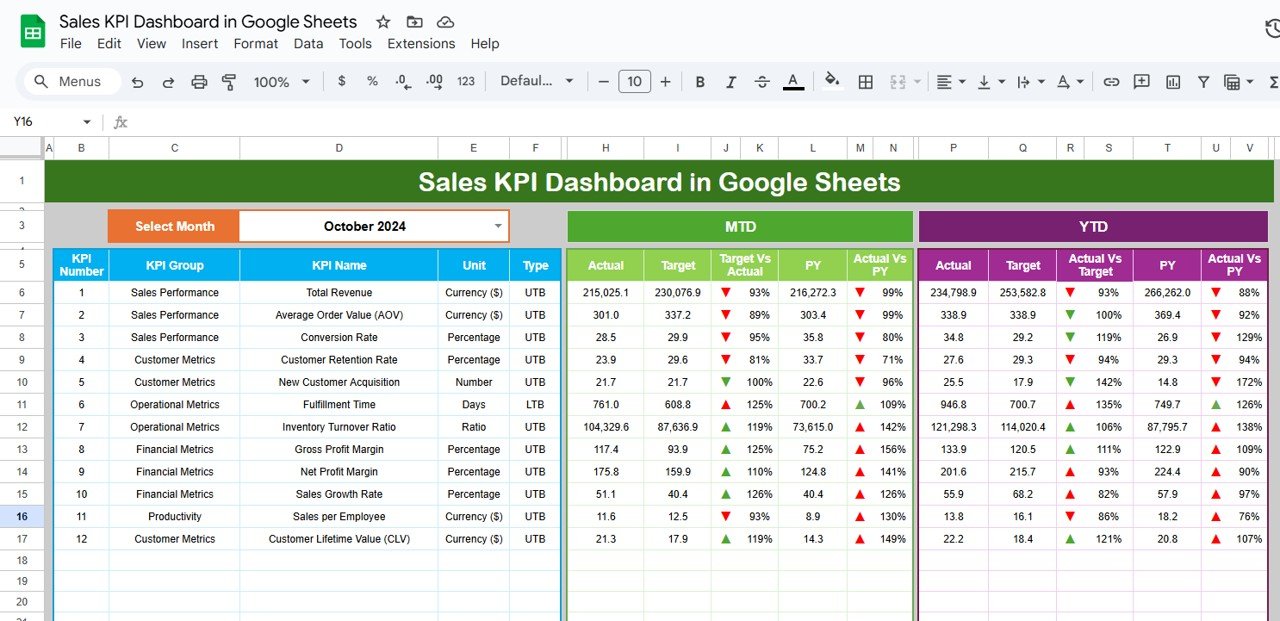
The Dashboard Sheet is the central hub of the Sales KPI Dashboard. Here, you will see an overview of all your sales KPIs, including key metrics such as MTD (Month-to-Date) and YTD (Year-to-Date) performance.
Key Features:
Click to buy Sales KPI Dashboard in Google Sheets
Dynamic Data: Select a month from the dropdown menu in cell D3, and the entire dashboard will update with the corresponding data for that month.
MTD & YTD Comparison: View both MTD Actual, Target, Previous Year (PY) data, and compare Target vs Actual performance, with conditional formatting (up/down arrows).
Performance Indicators: The dashboard shows YTD Actual, Target, Previous Year data, and Target vs Actual comparisons with conditional formatting for easy data interpretation.
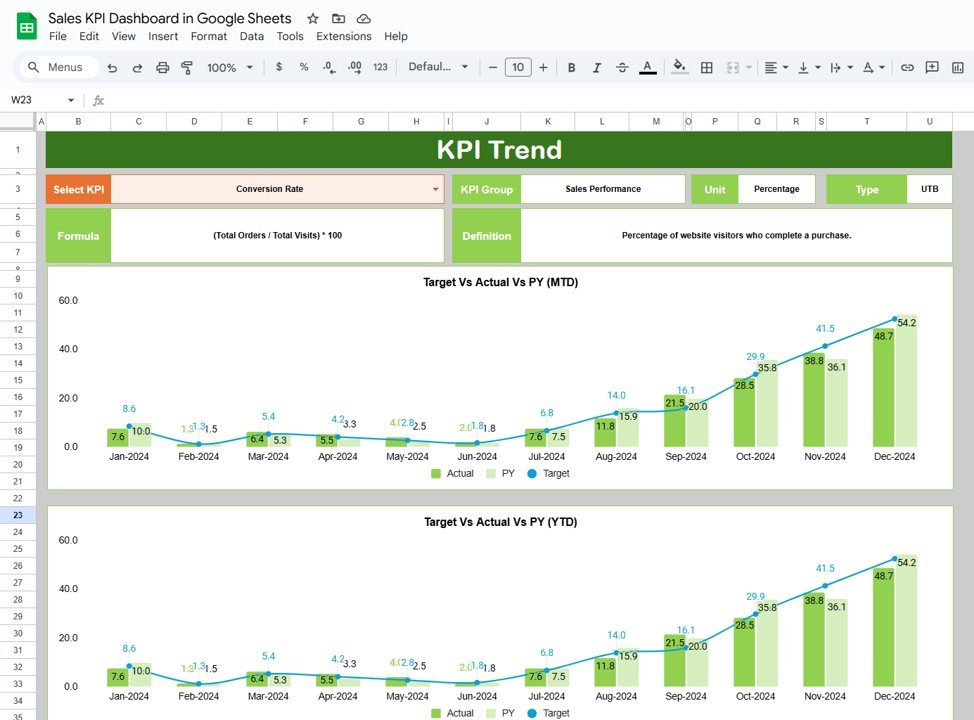
2. KPI Trend Sheet Tab
This sheet allows you to track the trends of different KPIs over time.
Key Features:
- Select a KPI from the dropdown (range C3) to view its KPI Group, Unit of KPI, and the Type of KPI (whether Lower the Better or Upper the Better).
- The sheet displays the Formula for the KPI and provides a definition, helping you understand how the KPI is calculated and its purpose.
Click to buy Sales KPI Dashboard in Google Sheets
3. Actual Number Sheet Tab
In this tab, you input the actual sales numbers for MTD and YTD.
Key Features:
- Enter the actual figures for the selected month by adjusting range E1 to set the first month of the year.

Click to buy Sales KPI Dashboard in Google Sheets
4. Target Sheet Tab
The Target Sheet is where you input your sales targets for both MTD and YTD.
Key Features:
- You can set specific target numbers for each KPI, ensuring that your team works towards defined sales goals.

Click to buy Sales KPI Dashboard in Google Sheets
5. Previous Year Numbers Sheet Tab
This sheet is used to enter data from the previous year, allowing for historical comparison.
Key Features:
- Input the same data as the current year to track performance over time and identify trends or improvements.

Click to buy Sales KPI Dashboard in Google Sheets
6. KPI Definition Sheet Tab
In this sheet, you will find a reference guide for each KPI.
Key Features:
- It includes the KPI name, KPI Group, Unit, Formula, and Definition, so your team understands how each metric is calculated and its importance.

Click to buy Sales KPI Dashboard in Google Sheets
Advantages of Using a Sales KPI Dashboard in Google Sheets
A Sales KPI Dashboard in Google Sheets offers several advantages for tracking and improving sales performance. Let’s look at some of the key benefits:
- Centralized Data Tracking: With all sales data in one place, it becomes easier to monitor and assess performance. Google Sheets allows you to manage everything from actual sales data to targets and previous year comparisons in one central location.
- Real-Time Updates: The ability to update the dashboard with current data ensures that your team has access to real-time performance metrics. This enables more timely decisions and actions to correct any underperformance.
- Customization and Flexibility: Google Sheets provides a flexible platform for creating a custom dashboard that fits the specific needs of your business. You can adjust the KPIs and data to suit your objectives, ensuring that the dashboard aligns with your company’s goals.
- Collaboration and Sharing: Google Sheets allows for easy sharing and collaboration. Multiple team members can view or update the dashboard simultaneously, ensuring that everyone is on the same page regarding sales performance.
- Cost-Effective: Google Sheets is a free tool, making it an affordable option for businesses of all sizes. You do not need to invest in expensive software solutions, yet you can still track and analyze critical sales data.
Opportunities for Improvement in a Sales KPI Dashboard
Click to buy Sales KPI Dashboard in Google Sheets
While a Sales KPI Dashboard in Google Sheets is incredibly useful, there are always opportunities to improve its functionality:
- Automation with Google Apps Script: By using Google Apps Script, you can automate data updates and integrate the dashboard with other tools like CRM systems or sales tracking software. This will save time and reduce manual entry.
- Enhanced Data Visualization: You can enhance the dashboard’s visuals by incorporating more sophisticated charts and graphs. This will make it easier to spot trends, outliers, and areas needing improvement.
-
Real-Time Data Integration: Instead of manual updates, consider integrating your Google Sheets with your CRM system to pull real-time data automatically. This will ensure that your dashboard is always up-to-date.
-
Data Validation for Accuracy: Implement data validation rules to ensure that only valid data is entered into the dashboard. This can help prevent errors and ensure that your performance metrics are accurate.
Best Practices for Using a Sales KPI Dashboard
Click to buy Sales KPI Dashboard in Google Sheets
To get the most out of your Sales KPI Dashboard in Google Sheets, here are some best practices to follow:
- Regular Updates: Ensure that you update your MTD and YTD data regularly to keep the dashboard relevant. Ideally, update it weekly or monthly to reflect the most current sales data.
- Monitor Key KPIs: Focus on tracking the KPIs that are most important for your sales goals. Regularly review them to ensure that you’re hitting your targets and adjust your strategy when necessary.
- Review Targets and Adjust: Set realistic, achievable sales targets. As you track performance, you may need to adjust your targets to reflect changes in the market or business environment.
- Use Conditional Formatting: Leverage conditional formatting (up/down arrows) to visually highlight performance, making it easier to interpret and take action based on the data.
- Involve the Team: Ensure that all relevant team members have access to the dashboard and are involved in the performance review process. This promotes accountability and encourages teamwork.
Frequently Asked Questions (FAQs) with Answers
Click to buy Sales KPI Dashboard in Google Sheets
Q1: What KPIs should I include in my Sales KPI Dashboard?
A1: Key KPIs to include are Sales Revenue, Sales Growth, Conversion Rate, Customer Acquisition Cost, Lead Response Time, and Average Deal Size.
Q2: Can I customize the dashboard to suit my business needs?
A2: Yes, you can easily customize the dashboard in Google Sheets by adding or removing KPIs, adjusting formulas, and modifying data ranges to match your business requirements.
Q3: How often should I update the data in the Sales KPI Dashboard?
A3: It’s best to update the dashboard on a weekly or monthly basis to ensure the data reflects the latest sales performance.
Q4: Can I automate data updates in the Sales KPI Dashboard?
A4: Yes, you can automate data updates by using Google Apps Script or integrating Google Sheets with other tools like your CRM to pull real-time data.
Q5: How do I interpret the data in the dashboard?
A5: Use the conditional formatting (up/down arrows) to quickly assess whether the KPIs are on track. If the numbers are below target, take corrective actions.
Conclusion
The Sales KPI Dashboard in Google Sheets is an essential tool for tracking and improving sales performance. It provides a centralized location for monitoring key metrics, comparing actual data to targets, and making data-driven decisions. By following best practices, regularly updating the dashboard, and leveraging advanced features like Google Apps Script, you can improve your sales performance and achieve your goals more effectively.
Visit our YouTube channel to learn step-by-step video tutorials
Youtube.com/@NeotechNavigators

