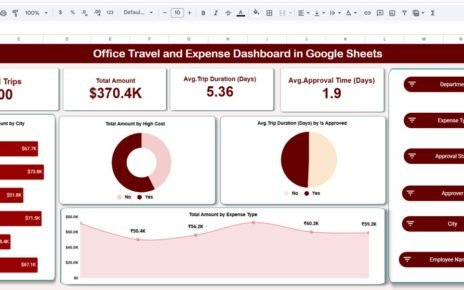
Managing sales performance and productivity effectively requires real-time tracking, goal alignment, and data-driven decision-making. The Sales Productivity & Target Management Dashboard in Google Sheets is designed to make all of this simple. It’s a ready-to-use, automated, and visual dashboard that lets you monitor targets, track productivity, and analyze performance across regions, sales reps, and products — all within Google Sheets.Sales Productivity & Target Management Dashboard in Google Sheets
This detailed guide explores the dashboard’s structure, charts, KPIs, advantages, best practices, and frequently asked questions.Sales Productivity & Target Management Dashboard in Google Sheets
What Is a Sales Productivity & Target Management Dashboard in Google Sheets?
Click to Buy Sales Productivity & Target Management Dashboard in Google Sheets
A Sales Productivity & Target Management Dashboard is an interactive analytics tool that visualizes sales performance against targets. It helps businesses understand how sales teams, products, and regions are performing month-to-month and year-to-date (YTD).Sales Productivity & Target Management Dashboard in Google Sheets
Built in Google Sheets, it combines key performance cards, charts, and search functionality — allowing users to instantly measure sales efficiency and identify gaps.Sales Productivity & Target Management Dashboard in Google Sheets
Overview Sheet Tab
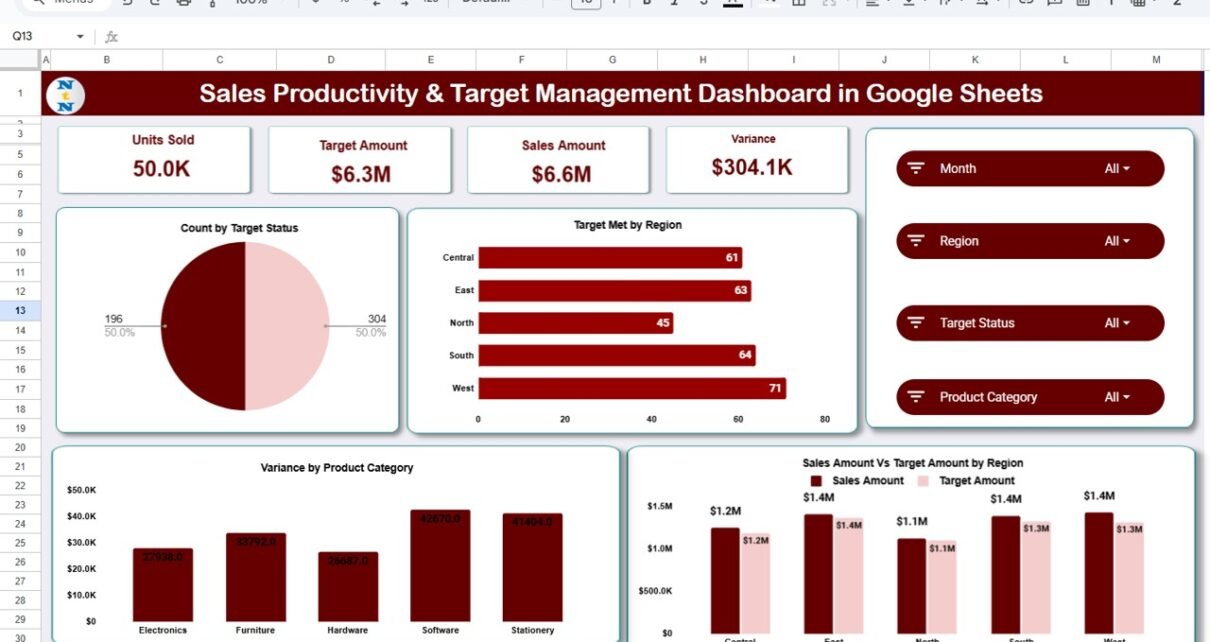
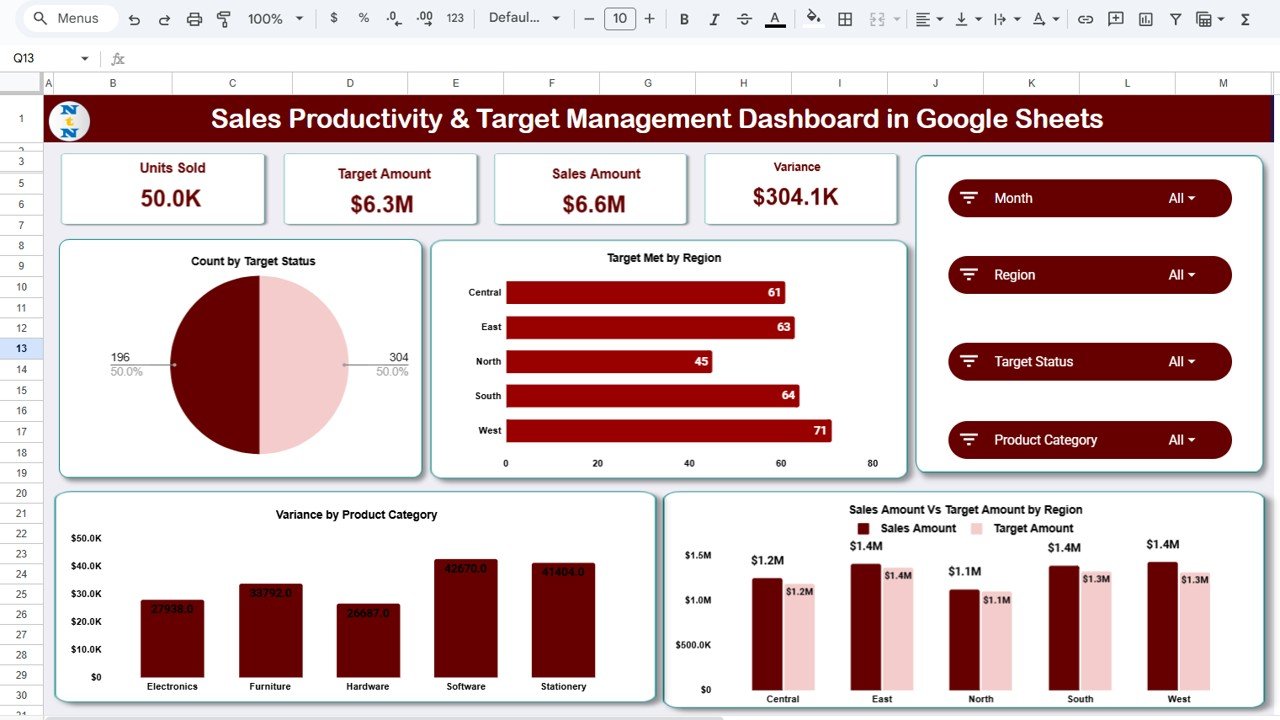
The Overview sheet is the main dashboard that summarizes your entire sales performance. It provides a quick, visual understanding of whether your sales activities are on track to meet targets.Sales Productivity & Target Management Dashboard in Google Sheets
KPI Cards
At the top of the dashboard, you’ll find summary cards for:
-
Units Sold – Total products sold during the selected period.
-
Target Amount – The sales goal set for that period.
-
Sales Amount – Actual revenue generated.
-
Variance – The difference between actual and target performance.
These KPIs instantly highlight performance gaps and achievements for the selected month.
Charts in the Overview Sheet
Click to Buy Sales Productivity & Target Management Dashboard in Google Sheets
-
Count by Target Status:
Shows how many regions, reps, or products met their targets. Helps management visualize goal completion rates. -
Target Met by Region:
Displays how many regions achieved or exceeded their targets, giving quick insight into geographic performance. -
Sales Amount vs Target Amount by Region:
Compares actual and target figures side-by-side for each region. -
Variance by Product Category:
Highlights which product lines are performing well and which ones need improvement.
These charts automatically update as data changes — allowing real-time insights.
Click to Buy Sales Productivity & Target Management Dashboard in Google Sheets
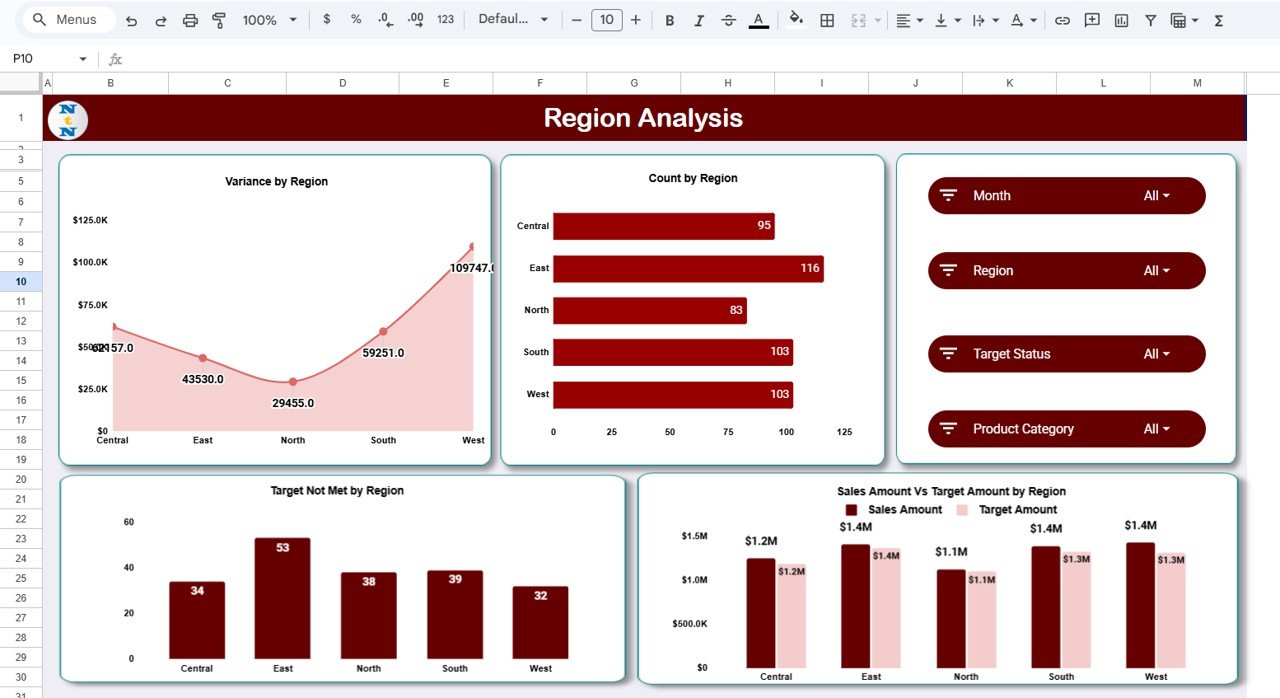
Region Analysis Sheet
The Region Analysis tab focuses specifically on regional sales trends.Sales Productivity & Target Management Dashboard in Google Sheets
Charts Included
-
Variance by Region:
Shows which regions have exceeded or lagged behind targets. -
Count by Region:
Displays the total number of sales transactions or deals per region. -
Sales Amount vs Target Amount by Region:
Compares performance metrics across multiple regions visually. -
Target Not Met by Region:
Helps identify areas that need attention for future strategy and support.
Click to Buy Sales Productivity & Target Management Dashboard in Google Sheets
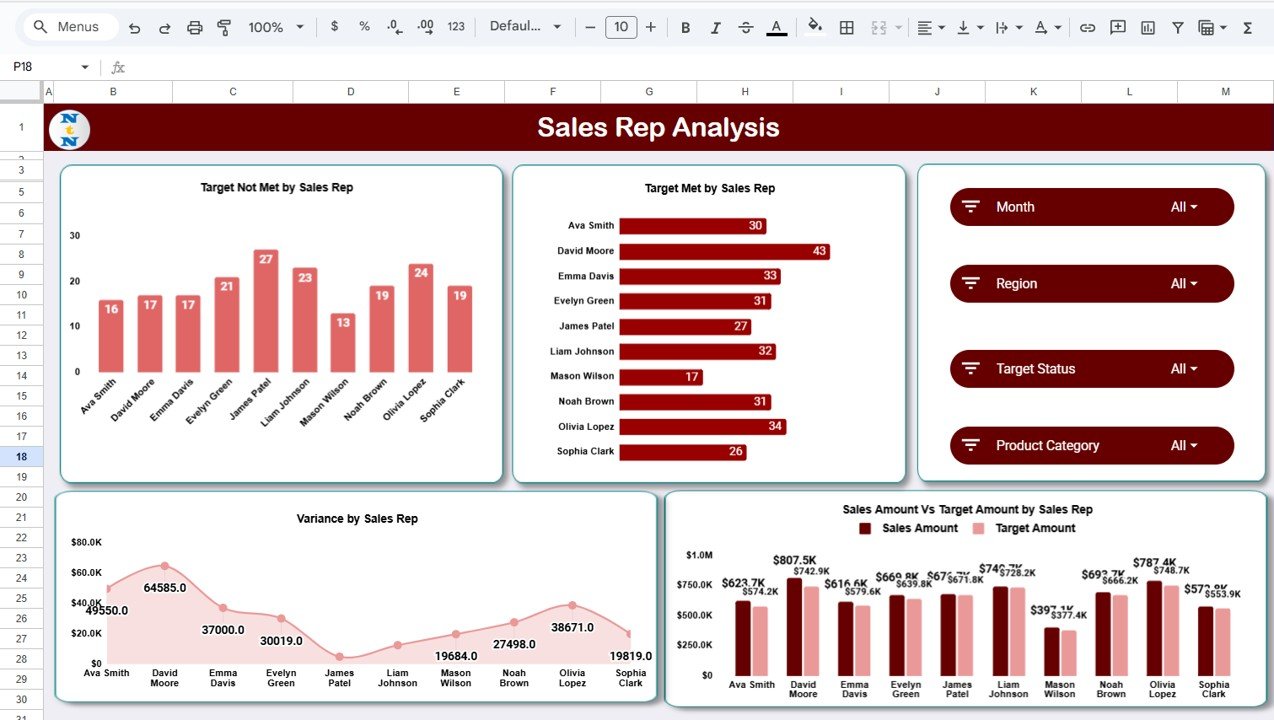
Sales Representative Analysis Sheet
This tab allows you to track the productivity and target achievements of each sales rep.
Charts Included
-
Target Not Met by Sales Rep:
Highlights underperforming sales reps for coaching or training interventions. -
Target Met by Sales Rep:
Displays the reps who met or exceeded their monthly or quarterly targets. -
Sales Amount vs Target Amount by Sales Rep:
Compares each salesperson’s actual performance against assigned goals. -
Variance by Sales Rep:
Quantifies performance differences to identify top performers and areas needing improvement.
This analysis promotes transparency and motivates the sales team to stay aligned with company objectives.
Click to Buy Sales Productivity & Target Management Dashboard in Google Sheets
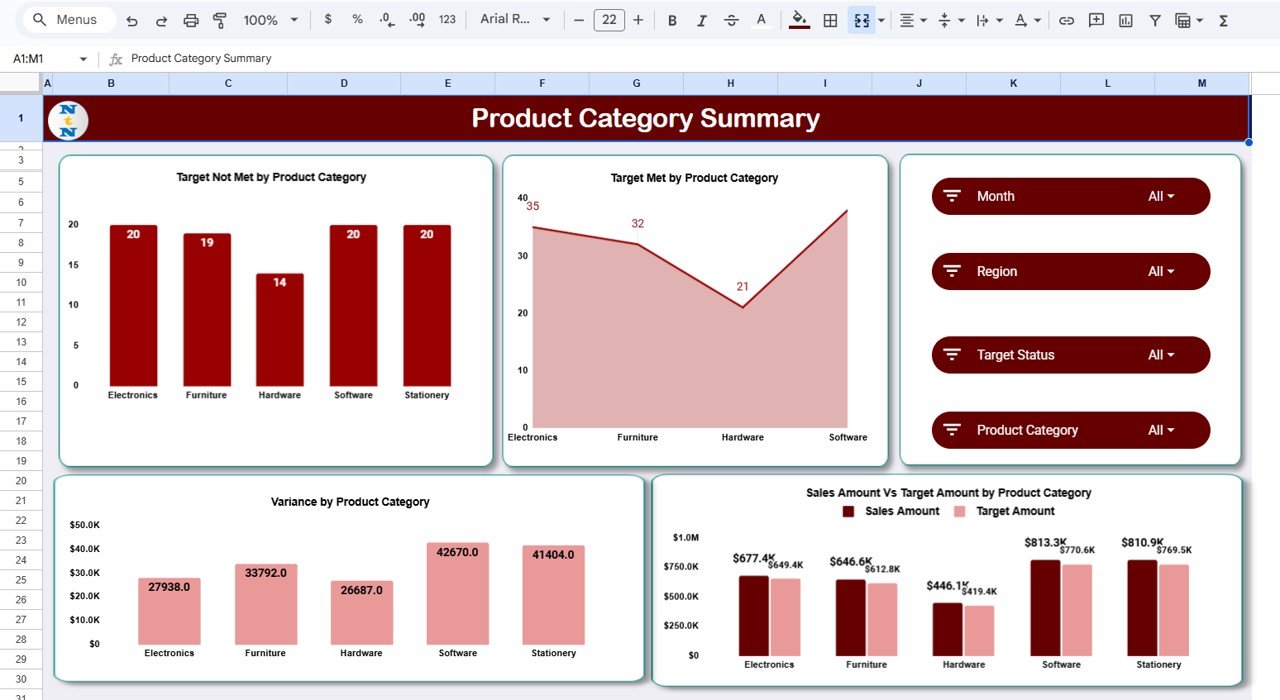
Product Category Summary
Product-level performance analysis is essential for strategic planning.
Charts Included
-
Target Not Met by Product Category – Shows which categories failed to hit targets.
-
Target Met by Product Category – Displays successful categories.
-
Sales Amount vs Target Amount by Product Category – Compares actual vs expected revenue.
-
Variance by Product Category – Highlights which product lines are profitable or lagging.
This sheet helps marketing and inventory teams align with high-performing product categories.
Click to Buy Sales Productivity & Target Management Dashboard in Google Sheets
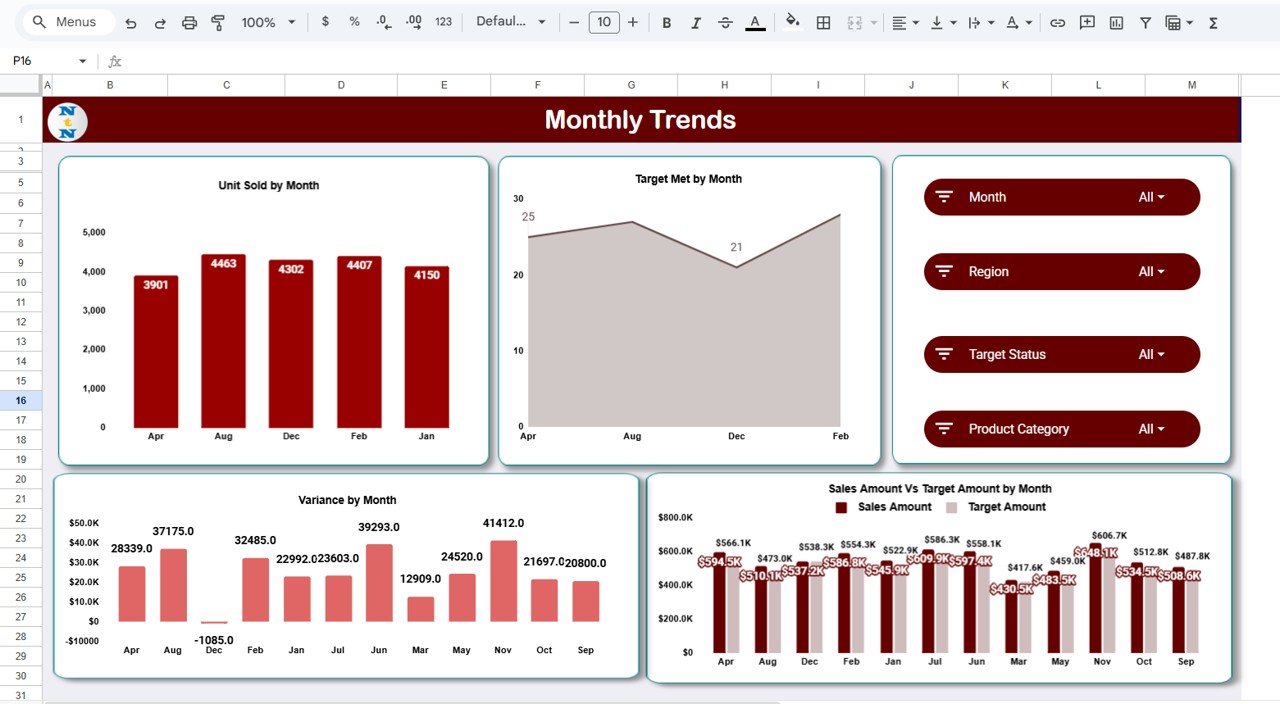
Monthly Trends
The Monthly Trends Sheet displays time-based sales analysis to understand patterns, seasonality, and consistency.
Charts Included
-
Units Sold by Month – Tracks monthly product sales volume.
-
Target Met by Month – Shows how many months hit their sales goals.
-
Sales Amount vs Target Amount by Month – Displays performance against targets over time.
-
Variance by Month – Identifies sales fluctuations and performance trends.
With these visuals, sales managers can forecast future performance more accurately.
Click to Buy Sales Productivity & Target Management Dashboard in Google Sheets
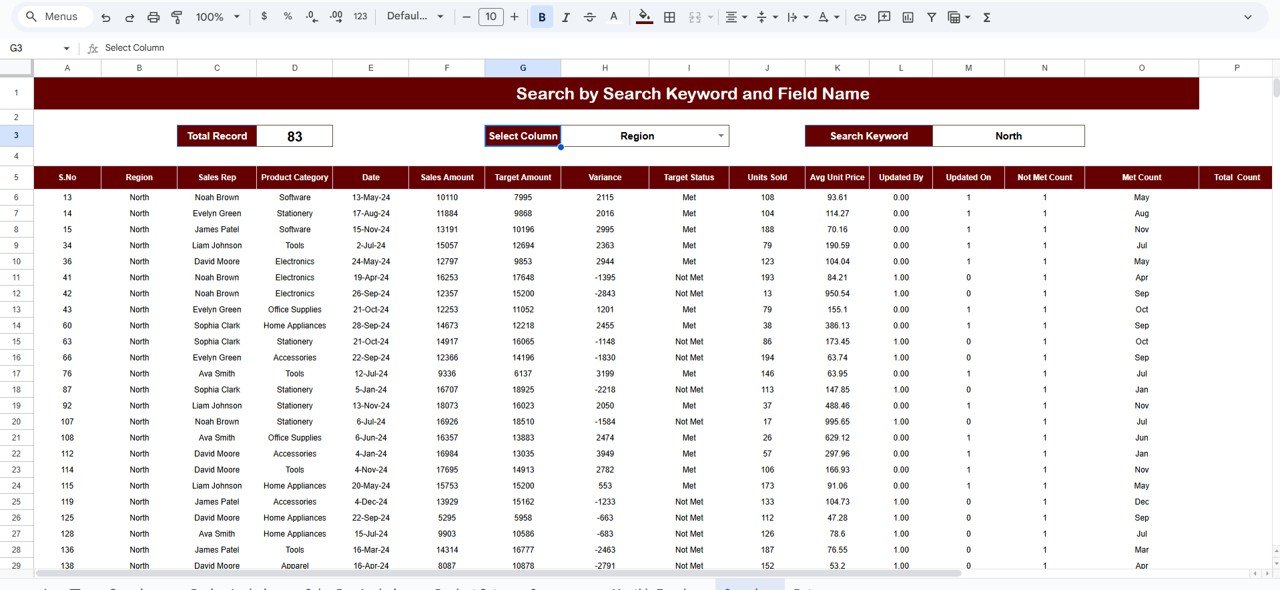
Search Feature
The Search Tab makes it easy to find specific records using keywords or field names.
For example:
-
Search “John Smith” to view one salesperson’s performance.
-
Type “North Region” to see only northern region data.
-
Type “Electronics” to filter all related sales records.
This feature saves time, especially for large sales teams managing hundreds of transactions.
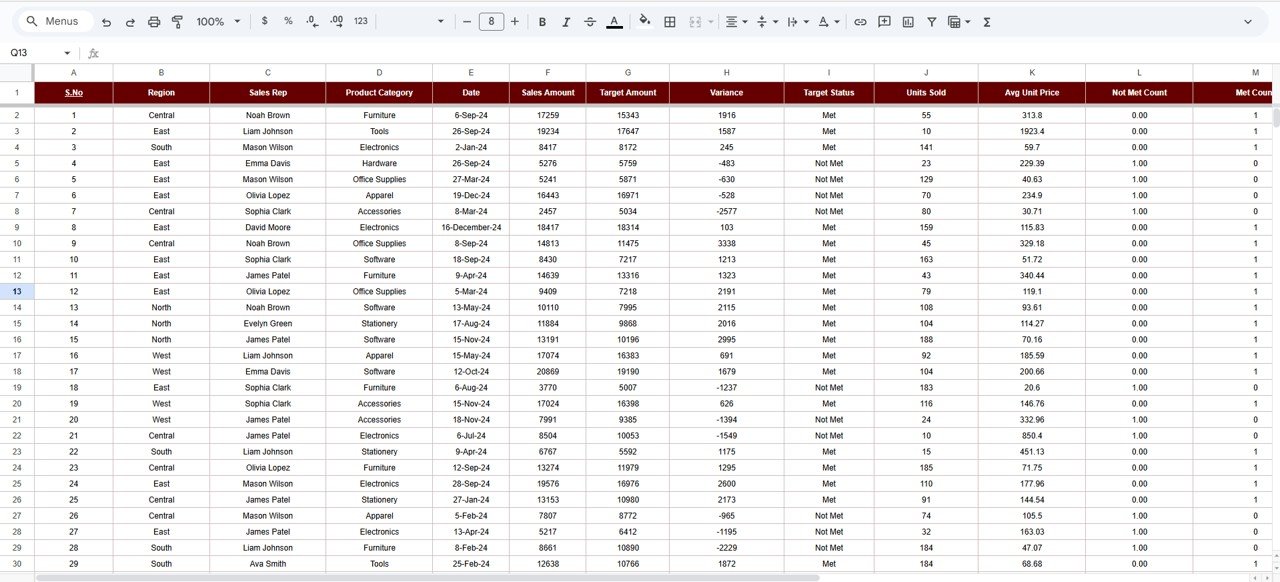
Data Sheet Tab
The Data Sheet stores all raw data that powers the entire dashboard.
Columns Typically Include:
- Date
- Region
- Sales Rep Name
- Product Category
- Units Sold
- Target Amount
- Sales Amount
- Variance
- Target Status (Met/Not Met)
Once this data is entered, all the visuals and summaries across the dashboard update automatically.
Click to Buy Sales Productivity & Target Management Dashboard in Google Sheets
Advantages of the Sales Productivity & Target Management Dashboard
-
Comprehensive Monitoring: Track sales from multiple dimensions — region, rep, product, and time.
-
Target Tracking Made Easy: Instantly view who’s meeting goals and who needs support.
-
Customizable Layout: Easily add new KPIs or filters.
-
Real-Time Insights: All charts update as soon as data changes.
-
Collaborative Access: Multiple team members can work on the same sheet simultaneously.
-
Data-Driven Decisions: Focus management efforts on low-performing regions or reps.
-
Visualization: Beautiful charts with traffic-light-style performance indicators.
Opportunities for Improvement
While this dashboard is complete, it can be enhanced with additional automation and analytics features:
-
Google Apps Script Automation: Automatically send alerts when targets are missed.
-
CRM Integration: Import data from HubSpot, Zoho, or Salesforce automatically.
-
Forecasting Tools: Add predictive trend charts for future target setting.
-
Commission Tracking: Include incentive and commission metrics for sales reps.
-
Dashboard Access Controls: Limit edit permissions to managers only.
Best Practices for Using the Dashboard
Click to Buy Sales Productivity & Target Management Dashboard in Google Sheets
-
Update Data Weekly: Keep performance data current to maintain dashboard accuracy.
-
Set SMART Targets: Ensure targets are realistic and measurable.
-
Train Sales Teams: Help reps understand KPI metrics and performance goals.
-
Review Monthly: Analyze regional and product trends regularly to realign goals.
-
Use Consistent Data Formats: Keep dates, numbers, and names standardized.
-
Backup Data: Maintain a copy of each month’s data for reference.
Conclusion
The Sales Productivity & Target Management Dashboard in Google Sheets is a powerful and accessible performance management tool. It transforms raw sales data into meaningful visuals that help teams stay focused, aligned, and productive.
With its dynamic charts, search functionality, and interactive layout, this dashboard allows sales leaders to track performance effortlessly and make smarter business decisions.
Whether you manage a small team or a nationwide network, this Google Sheets dashboard is a must-have for any results-driven sales organization.
Frequently Asked Questions (FAQ)
Click to Buy Sales Productivity & Target Management Dashboard in Google Sheets
1. Can I use this dashboard for multiple teams or regions?
Yes. You can filter and analyze data by regions, teams, or individuals.
2. Can the dashboard automatically update sales data?
Yes, you can automate updates using Google Apps Script or connect it to your CRM system.
3. Can I track commissions or incentives?
Yes. Add additional columns in the Data Sheet for incentive calculations.
4. Does the dashboard support YTD performance tracking?
Yes, you can calculate cumulative totals for year-to-date performance.
5. Is it suitable for product-based and service-based businesses?
Absolutely. The KPIs are flexible and can be adapted to any business model.
Visit our YouTube channel to learn step-by-step video tutorials
Youtube.com/@NeotechNavigators
Watch the step-by-step video Demo:
Click to Buy Sales Productivity & Target Management Dashboard in Google Sheets