In today’s digital-first world, businesses depend heavily on servers and IT infrastructure. Whether you run a website, SaaS platform, or enterprise system, server uptime directly impacts performance, revenue, and user experience. However, when organizations fail to track uptime metrics properly, they often face unexpected downtimes, system failures, and customer dissatisfaction.
So, how can you effectively monitor server performance and ensure maximum uptime?
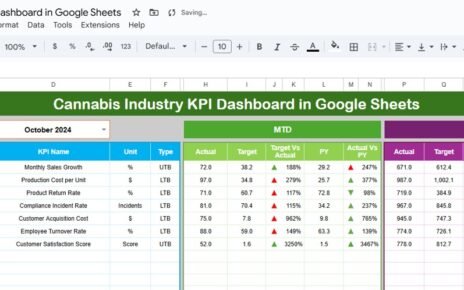
👉 The answer is the Server Uptime KPI Dashboard in Google Sheets.
This powerful and ready-to-use dashboard helps IT teams track, analyze, and optimize server performance using structured KPIs. Moreover, it converts raw uptime data into actionable insights, enabling faster and smarter decision-making.
In this detailed guide, you will learn everything about this dashboard, including features, KPIs, advantages, best practices, and FAQs.
📊 What is a Server Uptime KPI Dashboard in Google Sheets?
A Server Uptime KPI Dashboard in Google Sheets is an interactive tool that helps organizations track server availability, downtime, and performance metrics in a structured format.
Instead of relying on multiple monitoring tools, you can centralize KPI tracking in one dashboard. Therefore, teams can:
-
Monitor uptime performance
-
Track downtime incidents
-
Compare actual vs target metrics
-
Analyze trends over time
-
Improve IT reliability
Moreover, Google Sheets enables real-time collaboration, making it easy for teams to update and analyze data.
🤔 Why Do You Need a Server Uptime Dashboard?
Click to Buy Server Uptime KPI Dashboard in Google Sheets
Without proper monitoring, IT teams struggle to maintain system reliability. For example, downtime may go unnoticed, and response times may increase.
However, with this dashboard, you can:
-
Reduce downtime
-
Improve system availability
-
Enhance user experience
-
Ensure SLA compliance
-
Optimize IT operations
Therefore, this dashboard becomes essential for modern IT management.
🧩 Key Features of Server Uptime KPI Dashboard in Google Sheets
This dashboard includes 6 well-structured worksheets, each designed for specific functionality.
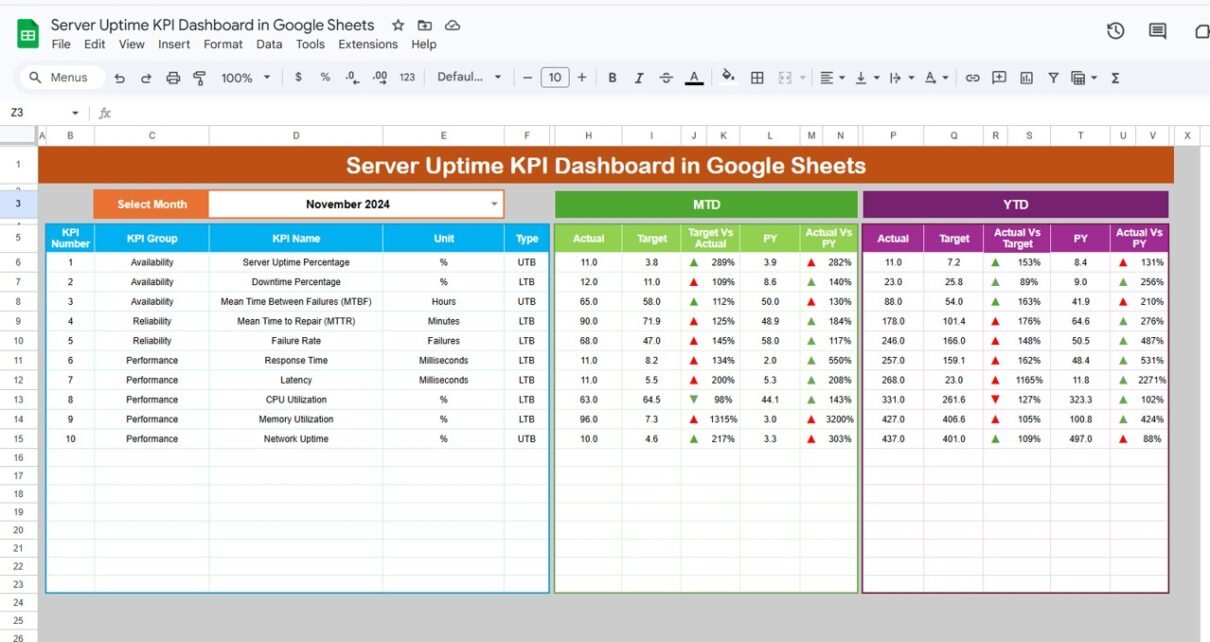
1️⃣ Dashboard Sheet – Central Performance View 📌
This is the main dashboard sheet where all KPI insights appear.
🔹 Key Features:
-
Month selector (Cell D3)
-
MTD (Month-to-Date) metrics
-
YTD (Year-to-Date) metrics
-
Target vs Actual comparison
-
Previous Year vs Actual comparison
-
Conditional formatting with up/down arrows
👉 As a result, users can instantly track performance for any selected month.

Click to Buy Server Uptime KPI Dashboard in Google Sheets
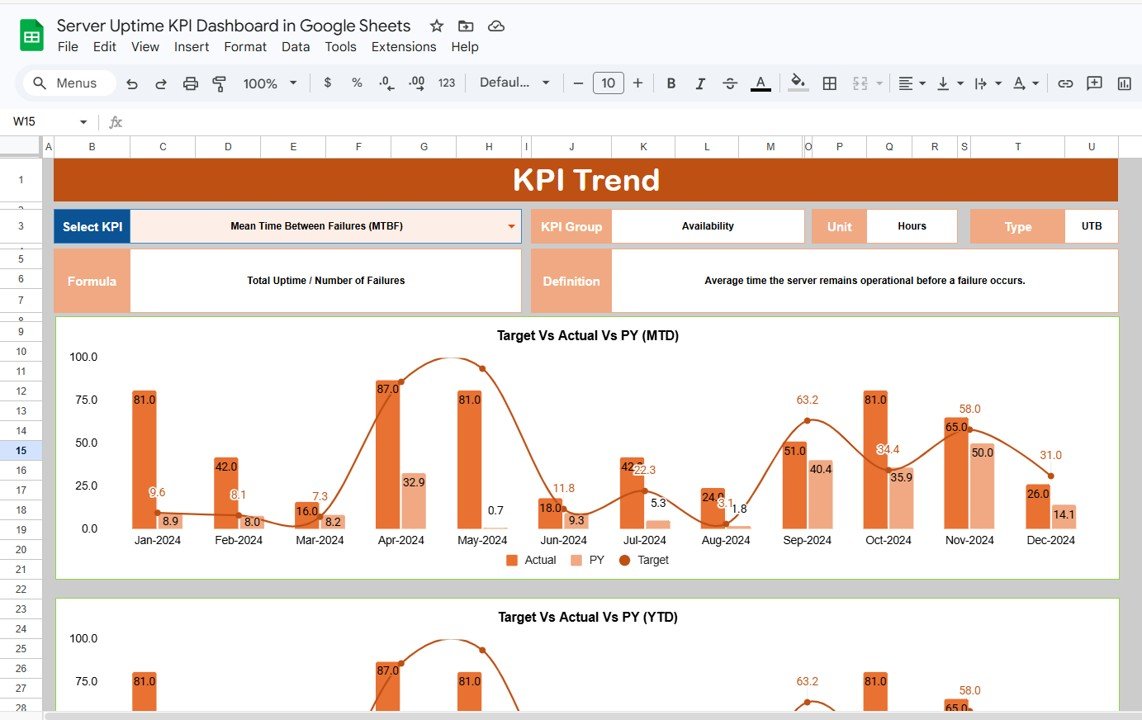
2️⃣ KPI Trend Sheet – KPI Analysis 📈
This sheet provides detailed insights into individual KPIs.
🔹 Features:
-
KPI selection dropdown (Cell C3)
-
KPI Group and Category
-
Unit of KPI
-
KPI Type (Lower the Better / Higher the Better)
-
KPI Formula
-
KPI Definition
👉 Therefore, you can understand each KPI clearly and analyze trends.
Click to Buy Server Uptime KPI Dashboard in Google Sheets
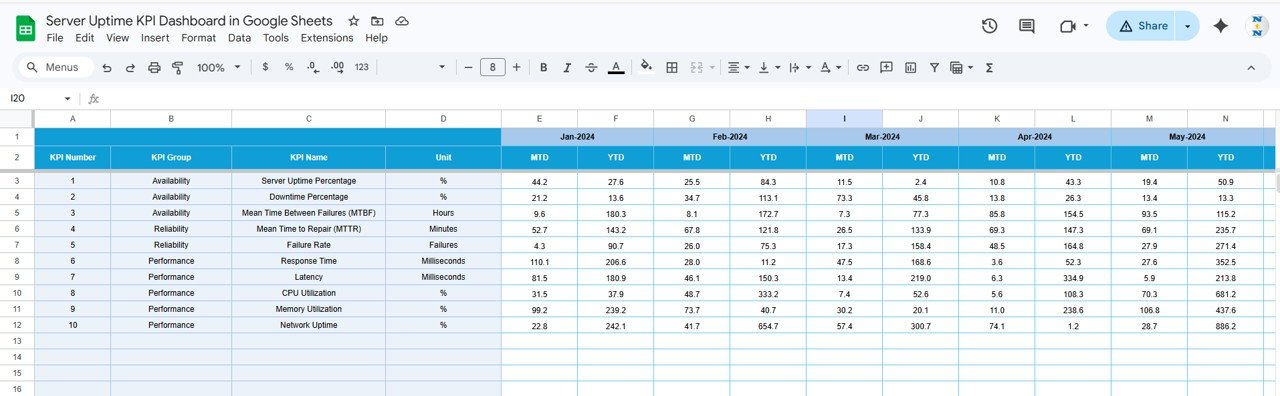
3️⃣ Actual Number Sheet – Data Entry 📊
This sheet stores actual performance data.
🔹 Features:
-
Enter MTD and YTD values
-
Month selection (Cell E1)
-
Structured input format
👉 As a result, data entry becomes simple and organized.
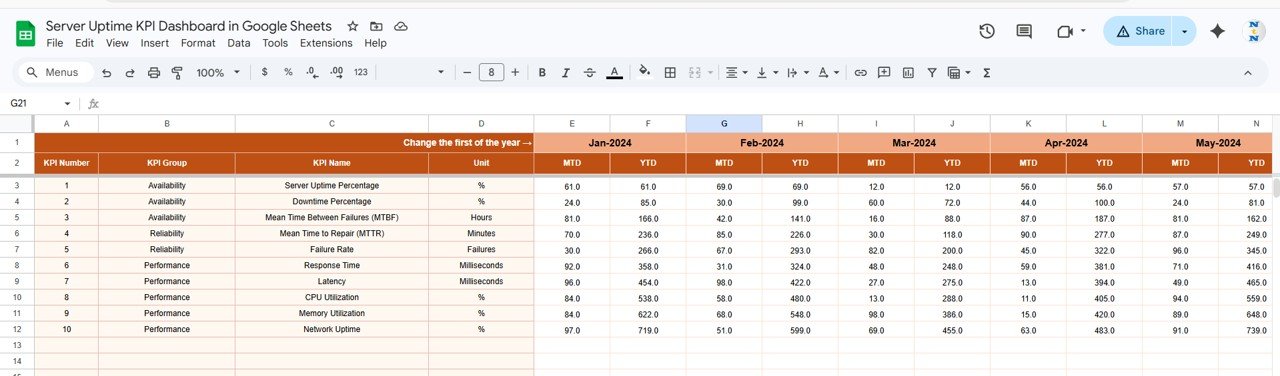
4️⃣ Target Sheet – KPI Goals 🎯
This sheet defines performance targets.
🔹 Features:
-
Monthly targets (MTD & YTD)
-
KPI-wise target tracking
👉 Therefore, you can measure performance against goals.
Click to Buy Server Uptime KPI Dashboard in Google Sheets
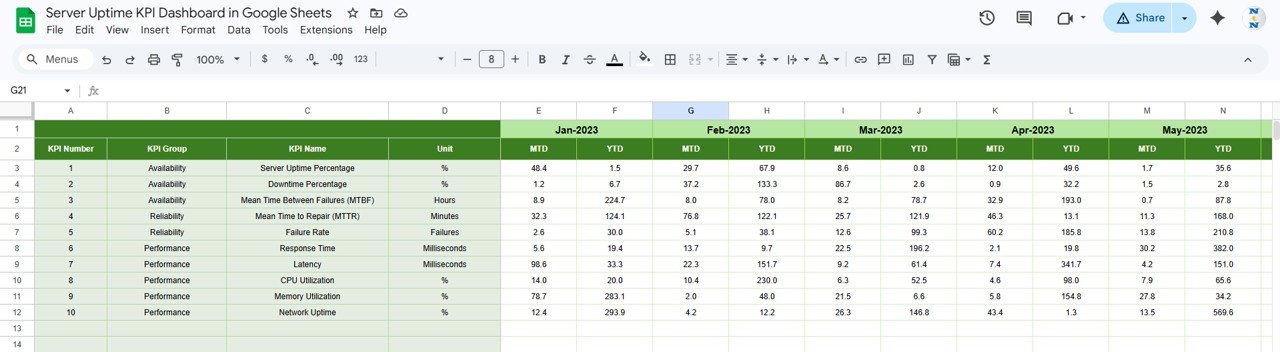
5️⃣ Previous Year Sheet – Historical Data 📅
This sheet stores previous year values.
🔹 Features:
-
Year-over-year comparison
-
Trend analysis
Click to Buy Server Uptime KPI Dashboard in Google Sheets
This sheet contains all KPI details.
🔹 Includes:
-
KPI Name
-
KPI Group
-
Unit
-
Formula
-
KPI Definition
👉 Therefore, users can easily understand metrics.
🚀 Advantages of Server Uptime KPI Dashboard in Google Sheets
✅ Improved System Reliability
-
Track uptime effectively
-
Reduce downtime incidents
✅ Better Decision-Making
-
Real-time KPI insights
-
Faster issue resolution
✅ Increased Efficiency
-
Organized data tracking
-
Streamlined processes
✅ Enhanced SLA Compliance
-
Monitor SLA metrics
-
Improve service delivery
✅ Cost-Effective Solution
-
No expensive tools required
-
Easy to implement
📈 How Does This Dashboard Improve IT Performance?
Click to Buy Server Uptime KPI Dashboard in Google Sheets
When teams monitor KPIs regularly:
-
They detect issues early
-
They resolve incidents faster
-
They improve system stability
-
They reduce operational risks
Therefore, overall IT performance improves significantly.
🛠️ Best Practices for Server Uptime KPI Dashboard
🔹 Keep Data Accurate
-
Ensure correct inputs
-
Avoid duplicate records
🔹 Monitor KPIs Regularly
-
Track daily or weekly
-
Identify trends
🔹 Set Realistic Targets
-
Align with SLA goals
-
Avoid unrealistic benchmarks
🔹 Use Visual Indicators
-
Highlight performance issues
-
Use conditional formatting
🔹 Automate Data Collection
-
Integrate with monitoring tools
-
Reduce manual effort
👨💻 Who Should Use This Dashboard?
Click to Buy Server Uptime KPI Dashboard in Google Sheets
-
IT Managers
-
DevOps Teams
-
System Administrators
-
Network Engineers
-
Business Owners
🔄 How to Use the Dashboard Effectively?
-
Enter actual data in the Actual Sheet
-
Set targets in the Target Sheet
-
Add previous year data
-
Define KPIs
-
Analyze dashboard insights
Click to Buy Server Uptime KPI Dashboard in Google Sheets
Visit our YouTube channel to learn step-by-step video tutorials