In the rapidly evolving world of agriculture, adopting smart technologies and data-driven practices is crucial for improving productivity, sustainability, and profitability. The Smart Agriculture KPI Dashboard in Google Sheets is a ready-to-use tool that helps farmers, agribusinesses, and agricultural managers track and analyze essential metrics in real time. This comprehensive dashboard allows you to monitor key performance indicators (KPIs) related to crop yield, resource usage, financial performance, and more.
In this article, we will guide you through the Smart Agriculture KPI Dashboard in Google Sheets, exploring its key features, the KPIs it tracks, and how it can help you optimize agricultural operations for greater success.
What is the Smart Agriculture KPI Dashboard in Google Sheets?
The Smart Agriculture KPI Dashboard in Google Sheets is a tool designed to help you track the performance of your agricultural operations through key performance indicators. Whether you are involved in crop production, livestock management, or farm resource optimization, this dashboard gives you a clear, real-time overview of your performance.
The dashboard is divided into six primary worksheets, each providing insights into different aspects of agricultural management. It is built in Google Sheets for easy data entry, collaboration, and real-time updates, making it an ideal solution for managing agricultural operations efficiently.
Key Features of the Smart Agriculture KPI Dashboard in Google Sheets
This dashboard includes six worksheets, each focusing on a specific aspect of agricultural performance:
1. Dashboard Sheet Tab
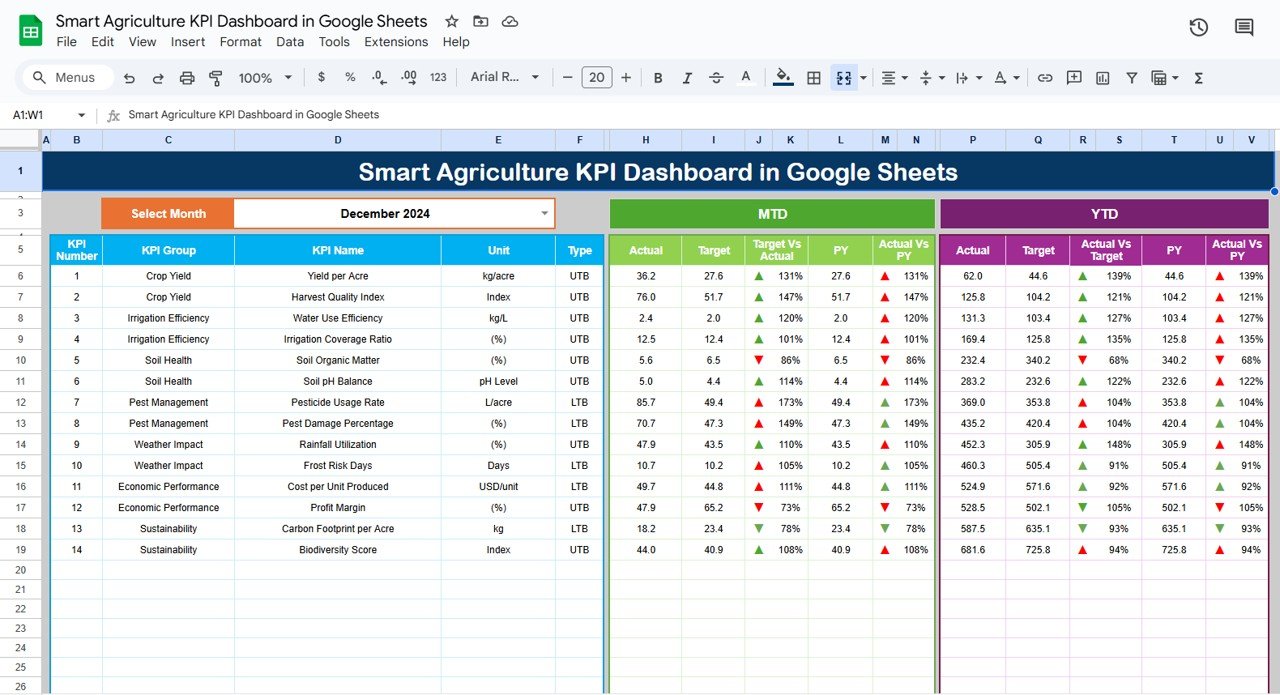
The Dashboard Sheet is the main page of the template and provides an overview of all the KPIs. The key features include:
MTD (Month-to-Date) and YTD (Year-to-Date) Metrics:
The dashboard shows MTD and YTD actual data, target values, and previous year (PY) data.
- Conditional Formatting: Arrows indicate whether the performance is above or below the target and PY values.
Key Metrics Displayed:
- MTD Actual: Actual performance for the selected month.
- MTD Target: Target value for the selected month.
- PY vs Actual: Comparison of the current month’s data with the same period from the previous year.
- YTD Actual: Cumulative performance for the year.
- YTD Target vs Actual: Comparison of the YTD target with actual performance.
Click to buy Smart Agriculture KPI Dashboard in Google Sheets
2. KPI Trend Sheet Tab
The KPI Trend Sheet helps you track the performance of individual KPIs over time:
KPI Selection Dropdown:
You can select a KPI from the dropdown in C3, and the sheet will display:
- KPI Group: The category of the KPI (e.g., production, resource management).
- Unit of KPI: The unit of measurement for the KPI (e.g., tons, liters, percentage).
- Type of KPI: Whether the KPI is “Lower the Better” or “Upper the Better.”
- Formula of KPI: How the KPI is calculated.
- KPI Definition: A description of what the KPI tracks and its relevance to agricultural performance.

Click to buy Smart Agriculture KPI Dashboard in Google Sheets
3. Actual Number Sheet Tab
The Actual Number Sheet is where you enter the actual data for each KPI for MTD and YTD. This sheet automatically updates the dashboard and KPI trends based on the data entered.
-
Monthly Data Entry:
Enter the actual numbers for each KPI for the selected month (indicated in E1) to keep the dashboard up-to-date.

Click to buy Smart Agriculture KPI Dashboard in Google Sheets
4. Target Sheet Tab
The Target Sheet allows you to input the target values for each KPI for both MTD and YTD. These targets provide benchmarks to measure performance.
-
Target Data Entry:
Enter the target values for each KPI, which will then be compared with actual performance on the dashboard.

Click to buy Smart Agriculture KPI Dashboard in Google Sheets
5. Previous Year Number Sheet Tab
The Previous Year Number Sheet stores the performance data from the previous year for comparison. This allows you to track progress year-over-year.
-
Previous Year Data Entry:
Enter the previous year’s data for each KPI to compare it with current performance and analyze trends.
Click to buy Smart Agriculture KPI Dashboard in Google Sheets
6. KPI Definition Sheet Tab
The KPI Definition Sheet provides clear definitions for each KPI, ensuring you understand what each metric tracks and why it’s important for agricultural performance.
-
KPI Definitions:
Define each KPI with details such as the name, group, unit, formula, and explanation of the metric.

Advantages of Using the Smart Agriculture KPI Dashboard
-
Comprehensive Performance Monitoring: Track all critical aspects of agricultural production in one place, from yield and resource efficiency to financial performance and sustainability.
-
Real-Time Insights: The dashboard updates in real-time as new data is entered, giving you up-to-date information for decision-making.
-
Easy Customization: The template is customizable to fit your specific farming operations, allowing you to track the KPIs that matter most to you.
-
Visual Performance Tracking: With charts, conditional formatting, and color-coded indicators, the dashboard provides easy-to-understand visual feedback on your performance.
-
Data-Driven Decisions: The dashboard empowers you to make informed decisions based on actual data, helping to optimize agricultural practices, reduce costs, and increase profitability.
Best Practices for Using the Smart Agriculture KPI Dashboard
Click to buy Smart Agriculture KPI Dashboard in Google Sheets
-
Update Data Regularly: Enter data frequently to keep the dashboard current and reflective of your operations.
-
Set Realistic Targets: Base your targets on historical data and market trends to set achievable goals for each KPI.
-
Monitor Trends: Regularly review the KPI Trend Sheet to identify patterns over time, helping you understand long-term performance and adjust strategies.
-
Leverage Insights for Process Improvement: Use the insights from the dashboard to optimize farming processes, reduce resource wastage, and improve overall efficiency.
Frequently Asked Questions (FAQs)
1. How do I update the Smart Agriculture KPI Dashboard?
Simply input the latest data for each KPI in the Actual Number Sheet, and the dashboard will automatically update.
2. Can I add more KPIs to the dashboard?
Yes, the dashboard is customizable, and you can add new KPIs or modify the existing ones to fit your farming needs.
3. How do I compare current performance with previous year’s data?
Enter previous year’s data in the Previous Year Number Sheet to make year-over-year comparisons.
Conclusion
Click to buy Smart Agriculture KPI Dashboard in Google Sheets
The Smart Agriculture KPI Dashboard in Google Sheets is an essential tool for monitoring and optimizing agricultural operations. By tracking key metrics like crop yield, resource efficiency, financial performance, and sustainability, the dashboard provides real-time insights that enable better decision-making. Whether you’re managing a large-scale farm or a small agricultural operation, this dashboard helps you stay on top of performance, improve productivity, and ensure long-term sustainability.
Visit our YouTube channel to learn step-by-step video tutorials
Youtube.com/@NeotechNavigators
Watch the step-by-step video Demo:
Click to buy Smart Agriculture KPI Dashboard in Google Sheets