The Smart Home Industry KPI Dashboard in Google Sheets is a powerful, ready-to-use template designed to help businesses in the smart home sector track key performance indicators (KPIs). This dashboard consolidates essential data for monitoring business performance across multiple areas such as sales, customer satisfaction, and product efficiency. The template allows businesses to manage data easily, ensuring efficient decision-making and enhanced performance tracking.
In this article, we will walk through the features of the Smart Home Industry KPI Dashboard and provide a detailed list of the KPIs it tracks, along with definitions, units, formulas, and their respective KPI types (whether Lower the Better or Upper the Better).
-
Table of Contents
ToggleKey Features of the Smart Home Industry KPI Dashboard in Google Sheets
The Smart Home Industry KPI Dashboard is divided into multiple worksheets, each focusing on a specific aspect of your business performance. Below is an overview of each sheet and its functionality:
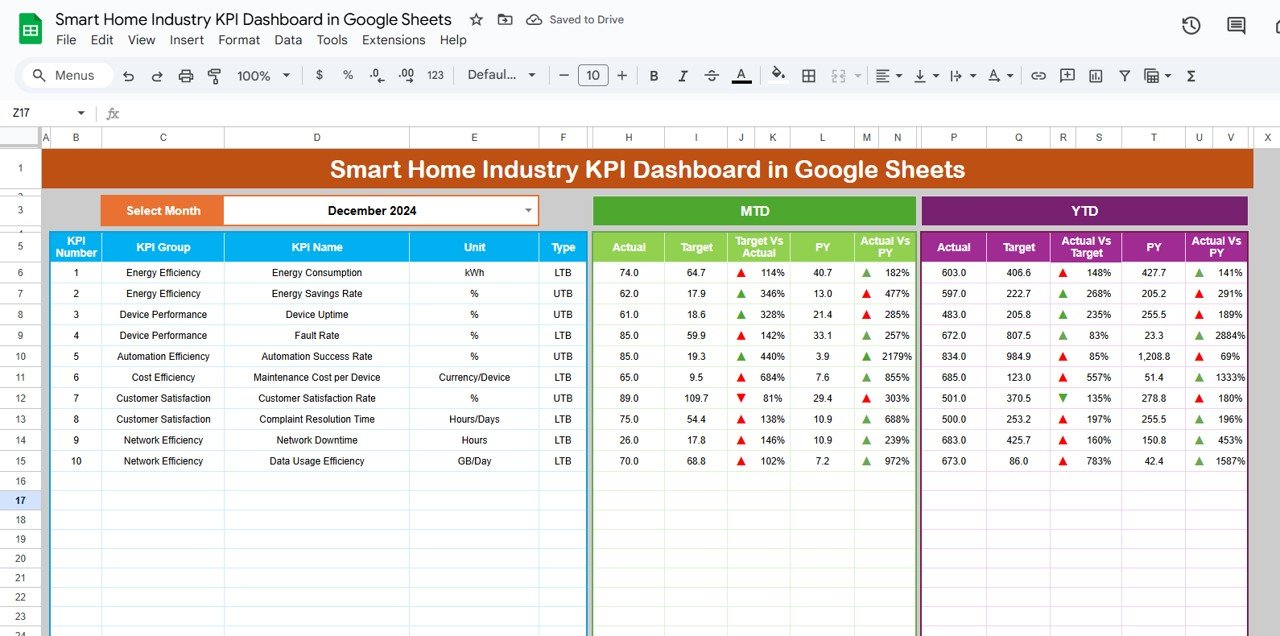
1. Dashboard Sheet Tab
The Dashboard Sheet Tab is the main sheet that provides an overview of all KPIs. It includes:
-
MTD (Month-to-Date) Actual: Displays actual data for the current month.
-
Target: Shows the target KPI values for the month.
-
Previous Year Data (PY): Compares current month data with the previous year’s figures.
-
Target vs. Actual: Shows whether actual values meet or exceed the target.
-
PY vs. Actual: Compares current year data with previous year data using conditional formatting (up/down arrows) to highlight performance.
You can select the month from a drop-down list in Range D3, and the dashboard will automatically update all KPIs for the selected month.
Click to buy Smart Home Industry KPI Dashboard in Google Sheets
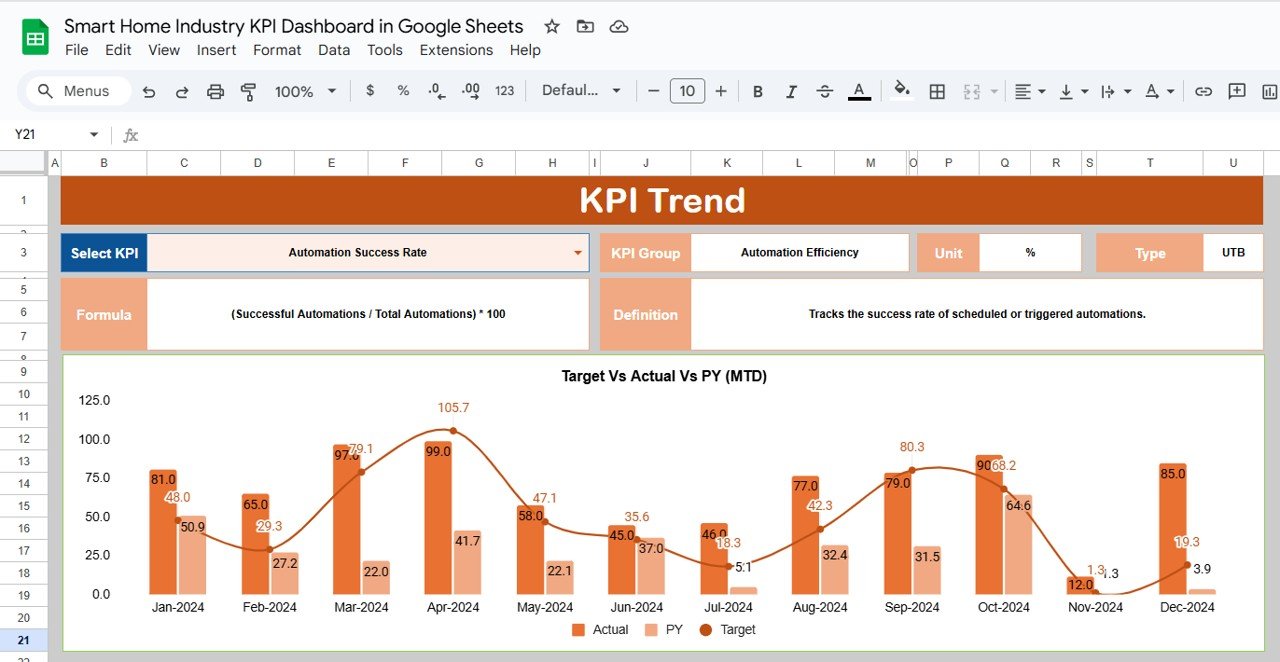
2. KPI Trend Sheet Tab
In this sheet, you can track trends for each KPI:
-
KPI Name: The name of the key performance indicator.
-
KPI Group: The group/category to which the KPI belongs (e.g., sales, customer satisfaction).
-
Unit: The unit of measurement for the KPI (e.g., dollars, units sold).
-
KPI Type: Specifies whether the KPI is Lower the Better or Upper the Better.
-
Formula: The formula used to calculate the KPI.
-
Definition: A brief description of what the KPI measures.
Users can select a specific KPI from the drop-down list in Range C3 to view its details.
Click to buy Smart Home Industry KPI Dashboard in Google Sheets
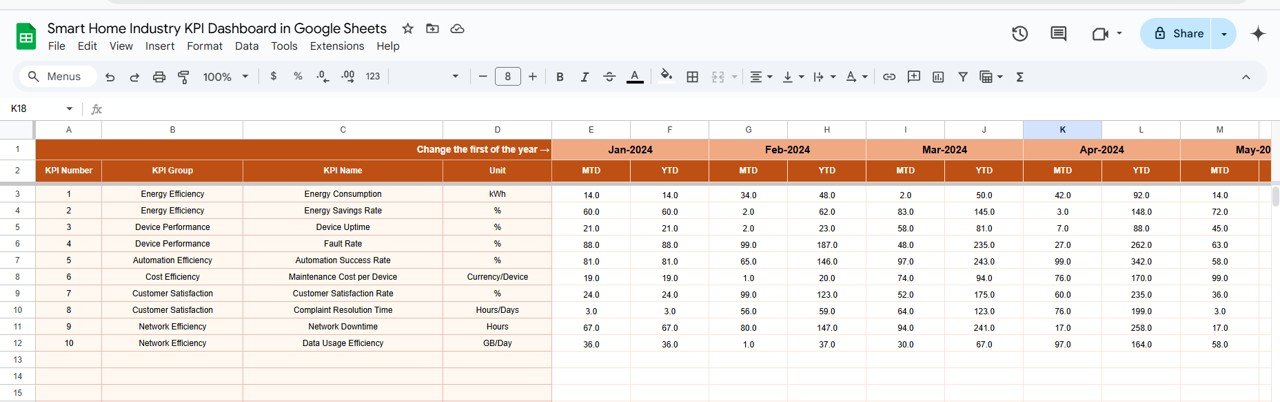
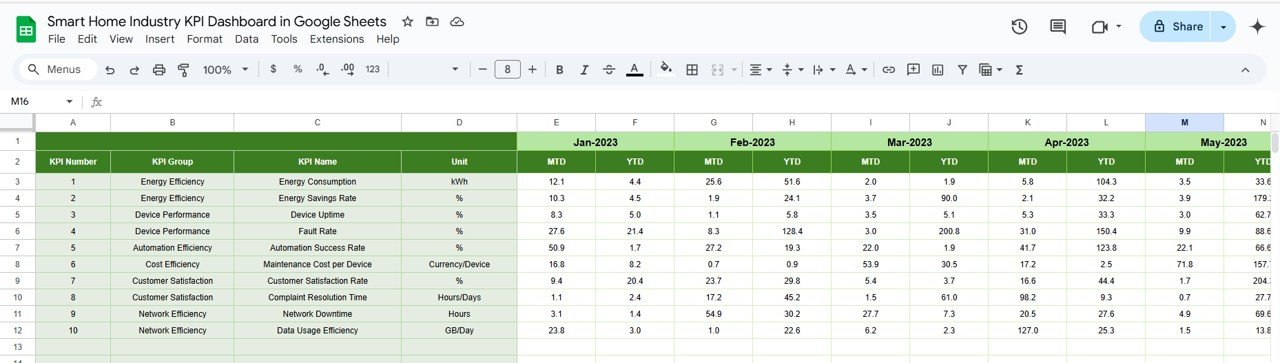
3. Actual Numbers Sheet Tab
This sheet is where you input actual performance data for MTD and YTD (Year-to-Date) for a particular month. You can change the month using Range E1, which automatically updates the data for that month.
Click to buy Smart Home Industry KPI Dashboard in Google Sheets
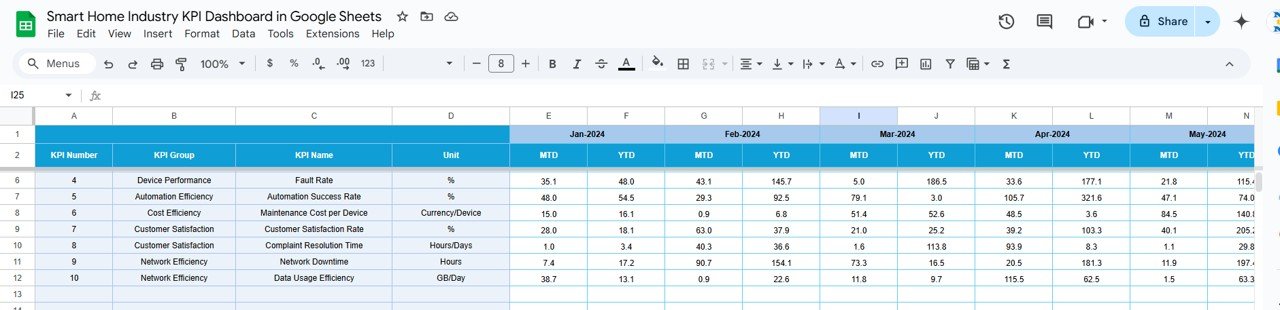
4. Target Sheet Tab
The Target Sheet Tab allows you to enter target figures for each KPI. You can input the target numbers for both MTD and YTD, ensuring that you track performance against predefined goals for the month and year.
5. Previous Year Numbers Sheet Tab
This sheet allows you to enter the figures from the previous year for comparison. You must input the same KPIs as the current year, enabling year-over-year comparisons for performance evaluation.
Click to buy Smart Home Industry KPI Dashboard in Google Sheets
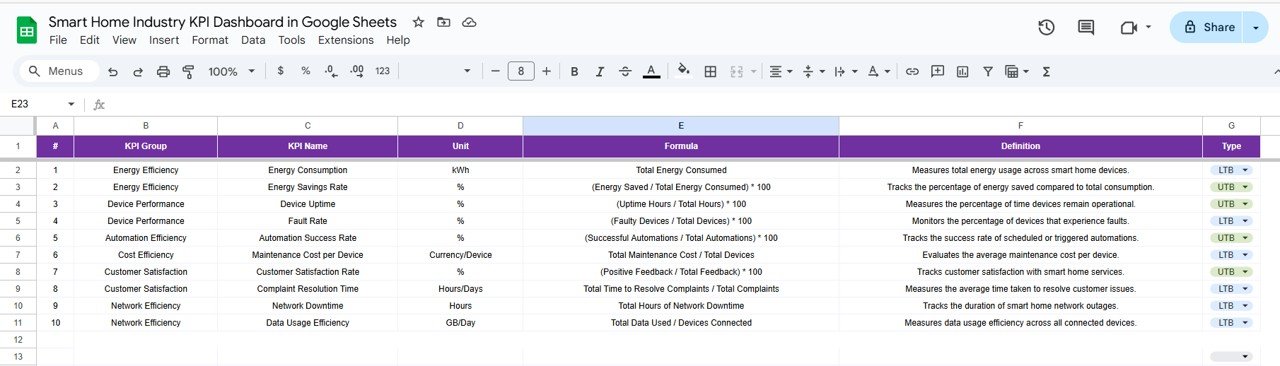
6. KPI Definition Sheet Tab
The KPI Definition Sheet Tab is a comprehensive guide to each KPI:
-
KPI Name: The name of the key performance indicator.
-
KPI Group: The category to which the KPI belongs (e.g., sales, customer service).
-
Unit: The unit of measurement for each KPI (e.g., units, revenue).
-
Formula: The formula used to calculate the KPI.
-
Definition: A short description of what each KPI measures
Click to buy Smart Home Industry KPI Dashboard in Google Sheets
Advantages of the Smart Home Industry KPI Dashboard
-
Centralized Data: All key business metrics are in one place, making it easier to track and analyze performance.
-
Real-Time Updates: By selecting the month, users can instantly see the most current data for their KPIs.
-
Improved Decision-Making: With access to KPIs like revenue, profit, and customer satisfaction, managers can make informed decisions that drive business growth.
-
Visual Performance Tracking: Conditional formatting with up/down arrows provides a quick visual indication of performance trends.
-
Customizable: The template can be tailored to track additional KPIs as per business needs.
Opportunities for Improvement in the Smart Home Industry KPI Dashboard
-
Automation: Automating the input of actual numbers and targets through integration with other business systems can save time and reduce human error.
-
Mobile Access: Optimizing the dashboard for mobile devices could improve accessibility for users on the go.
-
Advanced Analytics: Adding predictive analytics capabilities would allow for more robust forecasting and trend analysis.
Best Practices for Using the Smart Home Industry KPI Dashboard
Click to buy Smart Home Industry KPI Dashboard in Google Sheets
-
Regularly Update Data: Make sure actual figures and targets are updated regularly to ensure the dashboard reflects real-time performance.
-
Customize for Your Needs: Tailor the dashboard by adding KPIs that are specifically relevant to your business goals.
-
Monitor Performance Frequently: Regularly review the dashboard to catch potential issues early, such as declining customer satisfaction or inventory problems.
-
Use Conditional Formatting: Leverage up/down arrows and color coding to quickly assess whether your KPIs are on track or need attention.
Conclusion
The Smart Home Industry KPI Dashboard in Google Sheets is an essential tool for businesses looking to track key metrics and drive performance improvements in the smart home sector. With easy-to-read visualizations, real-time updates, and the ability to customize KPIs, this dashboard makes it easier than ever to monitor your business’s health and success.
Frequently Asked Questions (FAQs)
Click to buy Smart Home Industry KPI Dashboard in Google Sheets
1. What KPIs are included in the Smart Home Industry KPI Dashboard?
The dashboard tracks KPIs such as Total Revenue, Units Sold, Customer Satisfaction, Product Returns, Profit, Inventory Turnover Rate, and more.
2. How do I input data into the Smart Home Industry KPI Dashboard?
Data can be entered into the Actual Numbers, Target, and Previous Year sheets. The dashboard will automatically update based on the input.
3. Can I add more KPIs to the dashboard?
Yes, the dashboard is customizable, and you can add new KPIs as per your business needs.
4. How do I track performance trends?
You can track performance trends by using the KPI Trend sheet, which allows you to view historical data and analyze patterns over time.
5. How do I access the Smart Home Industry KPI Dashboard?
The dashboard is available in Google Sheets and can be easily accessed from any device with an internet connection
Visit our YouTube channel to learn step-by-step video tutorials
Youtube.com/@NeotechNavigators
Watch the step-by-step video Demo:
Click to buy Smart Home Industry KPI Dashboard in Google Sheets

