In today’s competitive smartphone industry, success depends on tracking performance across production, sales, customer service, and innovation. The Smartphone KPI Dashboard in Google Sheets provides a smart, structured, and dynamic way to measure, monitor, and visualize key business metrics — all in one automated file.
This ready-to-use dashboard helps smartphone manufacturers, distributors, and retailers make data-driven decisions through real-time performance tracking, interactive charts, and automated comparisons of actual vs target and previous year data.
What Is a Smartphone KPI Dashboard in Google Sheets?
The Smartphone KPI Dashboard is an analytics tool that consolidates all key performance indicators (KPIs) related to smartphone operations — from production and defect rates to revenue, sales, and customer satisfaction.
It allows users to view Month-to-Date (MTD) and Year-to-Date (YTD) values, compare performance against targets, and track changes visually using arrows and color coding.
All of this is built directly inside Google Sheets — requiring no coding, no expensive software, and minimal maintenance.
Dashboard Structure
Click to Buy Smartphone KPI Dashboard in Google Sheets
This dashboard includes six core worksheets, each serving a specific purpose:
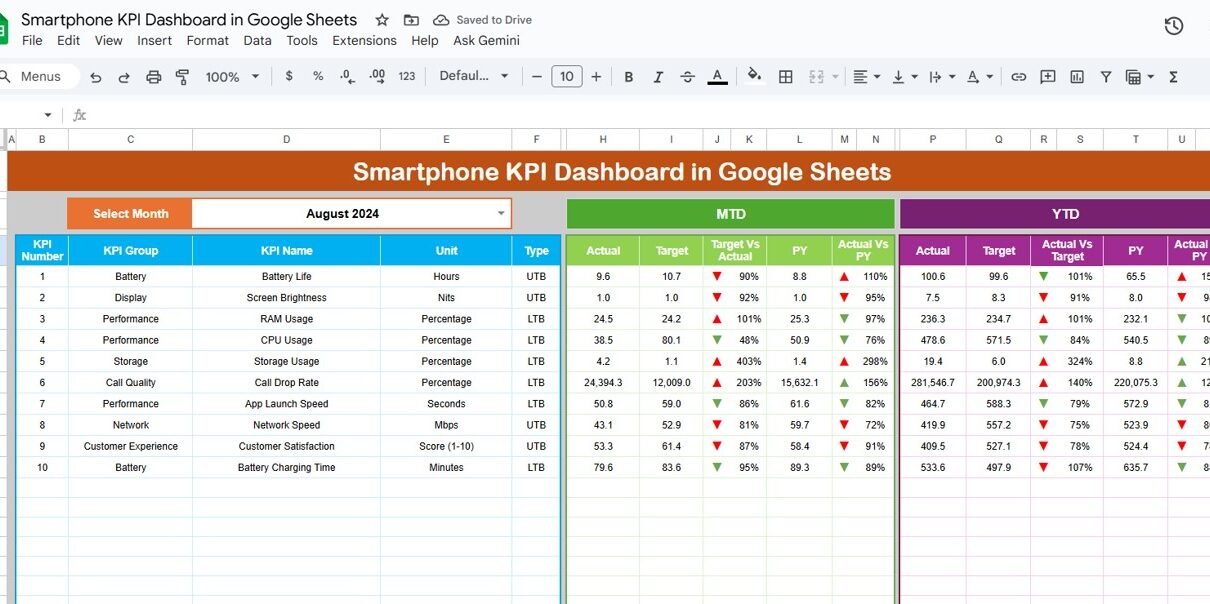
Dashboard Sheet Tab
This is the main visualization page, where all key data is presented in summary cards, performance tables, and trend visuals.
-
The Month Selector (Range D3) allows users to choose a month dynamically.
-
When a month is selected, all MTD and YTD metrics update automatically.
-
Arrows and colors indicate performance vs. target and previous year benchmarks.

Click to Buy Smartphone KPI Dashboard in Google Sheets
KPI Trend Sheet Tab
This tab enables detailed analysis of each KPI over time.
-
Choose a KPI from a dropdown in Range C3.
-
Displays KPI Group, Unit, Type (UTB/LTB), Formula, and Definition.
-
Includes trend charts showing MTD and YTD performance progress month-by-month.

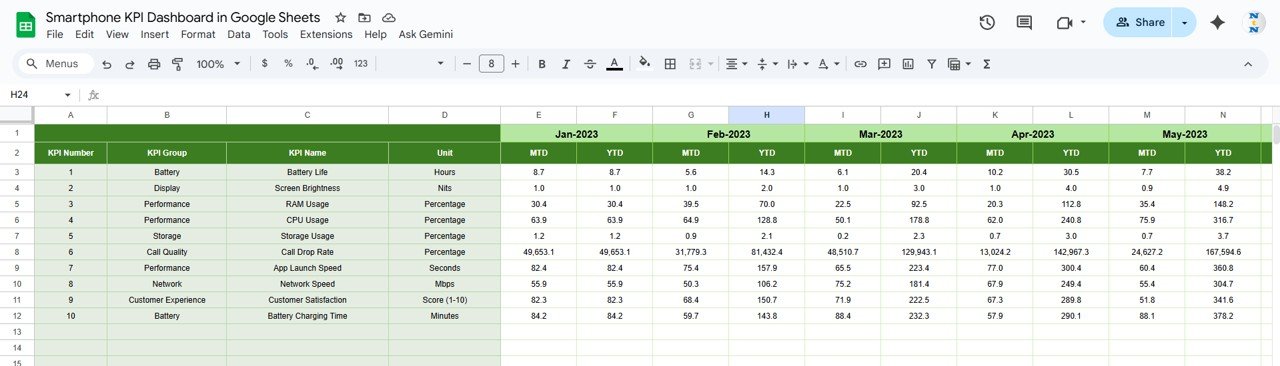
Actual Number Sheet Tab
This sheet records actual monthly and cumulative performance data.
-
Input MTD and YTD values for each KPI.
-
The month can be set in Range E1 to automatically adjust the reporting period.

Click to Buy Smartphone KPI Dashboard in Google Sheets
Target Sheet Tab
Here, users enter target data for each KPI, both MTD and YTD.
The dashboard uses these numbers to calculate achievement percentages and color-coded performance indicators.

Previous Year Number Sheet Tab
Stores previous year’s actual KPI data to enable year-over-year (YoY) analysis.
This provides valuable insight into trends, improvements, or declines.
Click to Buy Smartphone KPI Dashboard in Google Sheets
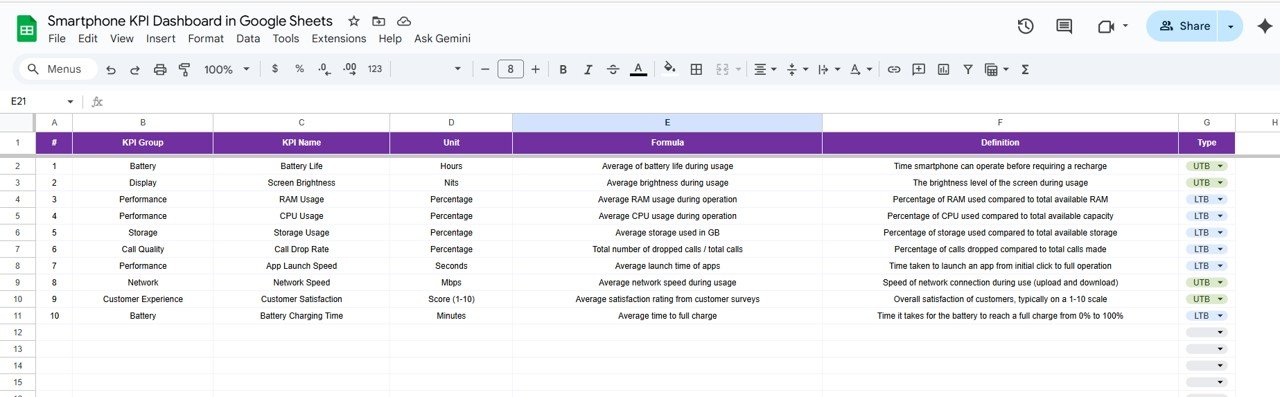
KPI Definition Sheet Tab
This sheet lists all KPIs with their groups, units, formulas, definitions, and performance type — indicating whether “higher is better” (UTB) or “lower is better” (LTB).
Advantages of the Smartphone KPI Dashboard
-
📈 Holistic View: Monitors every key business area — sales, operations, quality, and R&D.
-
📊 Data Visualization: Displays performance with charts, cards, and conditional colors.
-
🧮 Automated Calculations: Saves time with built-in KPI formulas.
-
💡 Comparative Analysis: Evaluates performance vs. target and previous year simultaneously.
-
☁️ Collaboration-Ready: Works seamlessly in Google Sheets for real-time team collaboration.
Opportunities for Improvement
Click to Buy Smartphone KPI Dashboard in Google Sheets
Enhance your dashboard by:
-
Adding regional sales and production breakdowns.
-
Including profit margin KPIs for deeper financial insights.
-
Integrating Google Forms to collect customer satisfaction data automatically.
-
Creating forecasting sheets to predict sales trends.
-
Automating monthly summary reports using Google Apps Script.
Best Practices
Click to Buy Smartphone KPI Dashboard in Google Sheets
-
Update actual and target data regularly to maintain accuracy.
-
Use consistent product IDs and naming conventions.
-
Compare MTD and YTD values monthly to spot performance gaps.
-
Validate cost and defect data before analysis.
-
Review warranty claim rates quarterly to identify product quality trends.
Conclusion
The Smartphone KPI Dashboard in Google Sheets is a comprehensive and automated analytics tool that helps smartphone manufacturers and retailers evaluate their operational performance, quality standards, and customer satisfaction in real time.
With visual insights, automated calculations, and comparison metrics, this dashboard empowers management teams to make faster, smarter, and data-driven decisions.
Visit our YouTube channel to learn step-by-step video tutorials
Youtube.com/@NeotechNavigators
Watch the step-by-step video Demo: