Efficient use of workspace, meeting areas, and event facilities is a key factor for organizational productivity and cost optimization. Tracking how spaces are booked, how often they’re used, and how satisfied users are can lead to better planning and resource management.
The Space Utilization Dashboard in Google Sheets is a ready-to-use, interactive tool designed to help organizations visualize and analyze how their spaces are being utilized — all in one place.Space Utilization Dashboard in Google Sheets
In this comprehensive guide, we’ll explore its structure, features, charts, benefits, opportunities for improvement, best practices, and wrap up with a FAQ section for practical understanding.Space Utilization Dashboard in Google Sheets
What Is a Space Utilization Dashboard in Google Sheets?
A Space Utilization Dashboard in Google Sheets helps businesses monitor booking patterns, attendance, costs, and user feedback related to different spaces or rooms.Space Utilization Dashboard in Google Sheets
Built entirely in Google Sheets, it automatically aggregates data into meaningful visuals such as charts and KPIs, allowing administrators and facility managers to make data-driven decisions about space management.Space Utilization Dashboard in Google Sheets
It’s ideal for offices, universities, coworking spaces, hotels, and event venues looking to track performance without needing complex software or coding.Space Utilization Dashboard in Google Sheets
Dashboard Overview
Click to Buy Space Utilization Dashboard in Google Sheets
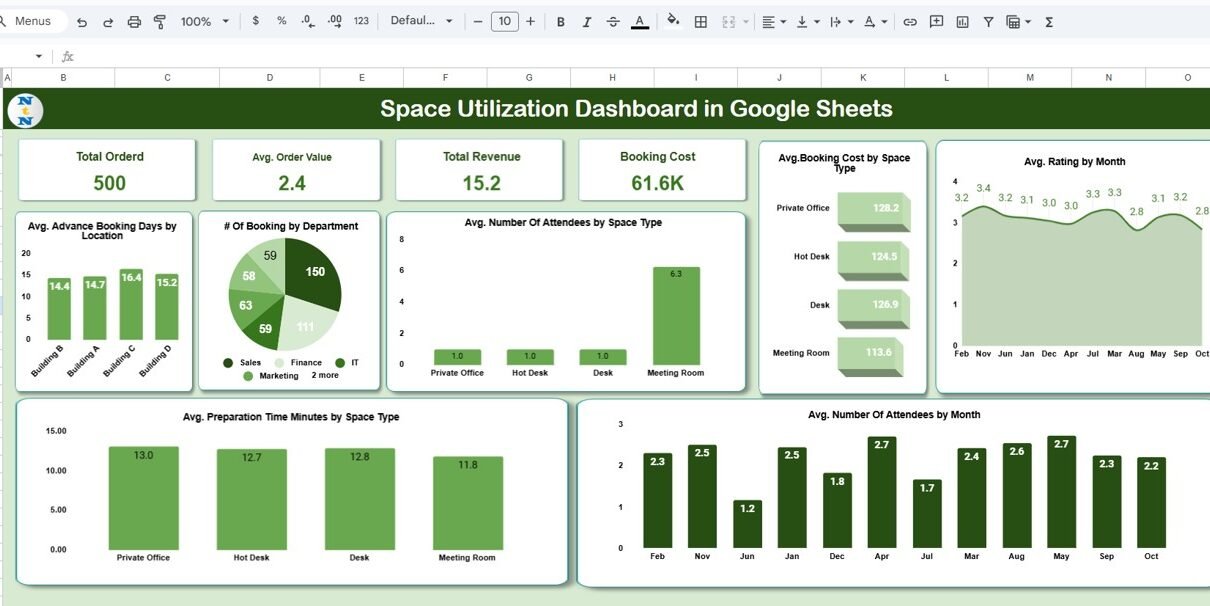
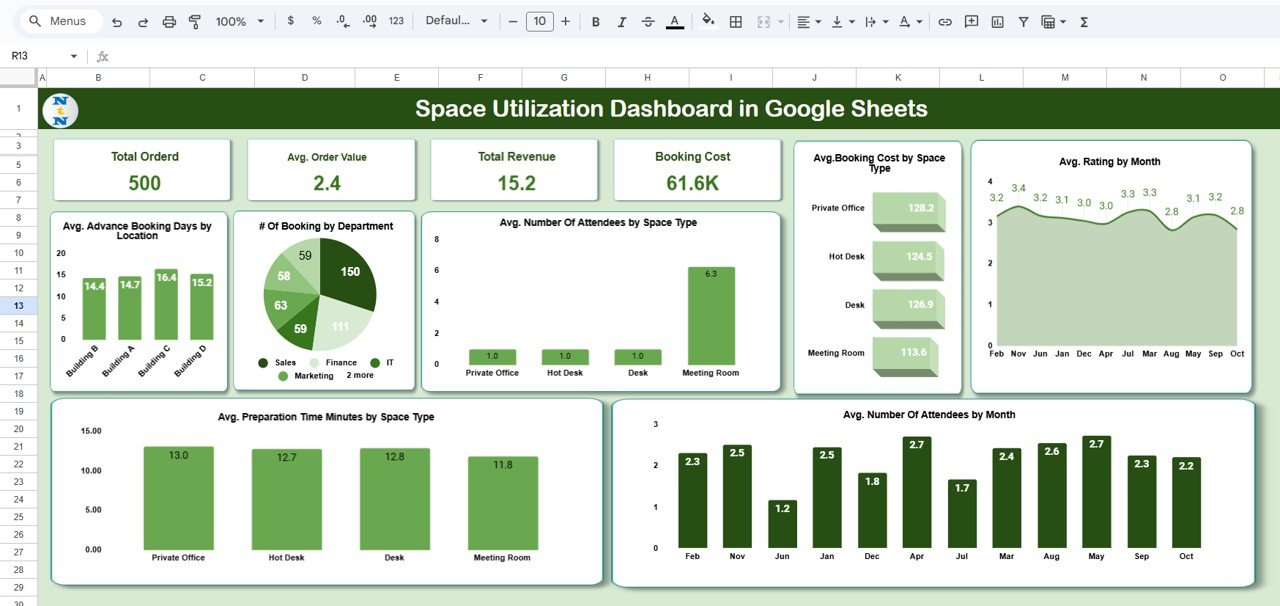
The Dashboard sheet is the heart of this tool — a one-stop summary of all critical space utilization metrics. It provides real-time insights through KPI cards and visual charts, enabling managers to instantly understand how effectively each space is being used.
🎯 KPI Cards
At the top of the dashboard, you’ll find performance summary cards that provide key metrics at a glance:
-
Total Ordered – The total number of bookings made across all spaces.
-
Average Order Value – The average revenue generated per booking.
-
Total Revenue – The cumulative income generated from all bookings.
-
Booking Cost – The overall expenses associated with space reservations (e.g., maintenance, setup costs).
These KPIs give management a quick financial and operational overview of space performance.
📈 Key Charts in the Dashboard
The dashboard features a range of dynamic charts that help visualize utilization patterns, booking trends, and user behavior.
1️⃣ Avg. Advance Booking Days by Location
Shows how far in advance spaces are booked, segmented by location. This helps assess planning behavior and identify high-demand areas that need earlier scheduling.
2️⃣ # of Bookings by Department
Displays which departments or teams are booking spaces most frequently. It helps understand demand distribution across departments.
3️⃣ Avg. Number of Attendees by Space Type
Highlights how many people typically attend events or meetings in each type of space (e.g., Conference Room, Auditorium, Training Hall).
4️⃣ Avg. Booking Cost by Space Type
Compares average booking costs across space types, revealing which spaces are the most or least cost-efficient.
5️⃣ Avg. Rating by Month
Tracks monthly satisfaction ratings provided by users after using the space. This is essential for maintaining quality and service standards.
6️⃣ Avg. Number of Attendees by Month
Displays attendance trends throughout the year, helping forecast staffing and logistics requirements.
7️⃣ Avg. Preparation Time (Minutes) by Space Type
Measures how long it takes to prepare each type of space before use. Monitoring prep time helps optimize maintenance and scheduling efficiency.
Click to Buy Space Utilization Dashboard in Google Sheets
These visuals collectively make it easier to understand how spaces are being used, how well they’re performing, and where improvements can be made.
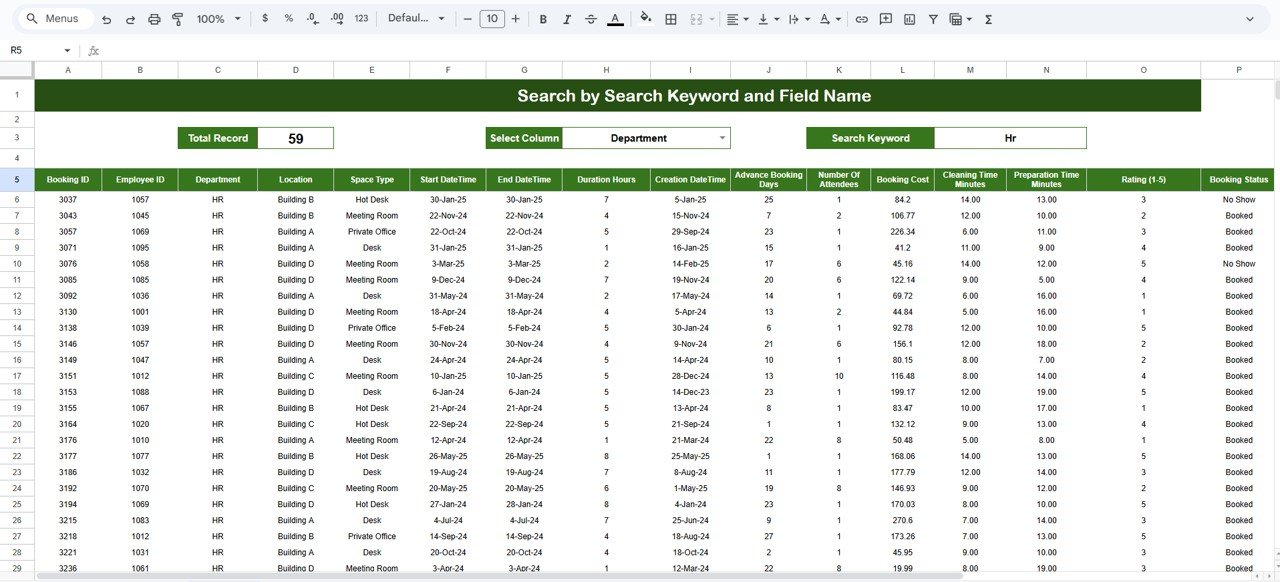
Search Feature
The Search Tab allows users to quickly find specific records. You can search by keyword or field name, making it easy to locate booking details without scrolling through long data tables.
For example:
-
Type “Conference Room” to view all related bookings.
-
Search “HR Department” to see their utilization pattern.
-
Filter “June” to analyze bookings for a particular month.
This feature is particularly useful for large organizations with hundreds of bookings.
Click to Buy Space Utilization Dashboard in Google Sheets
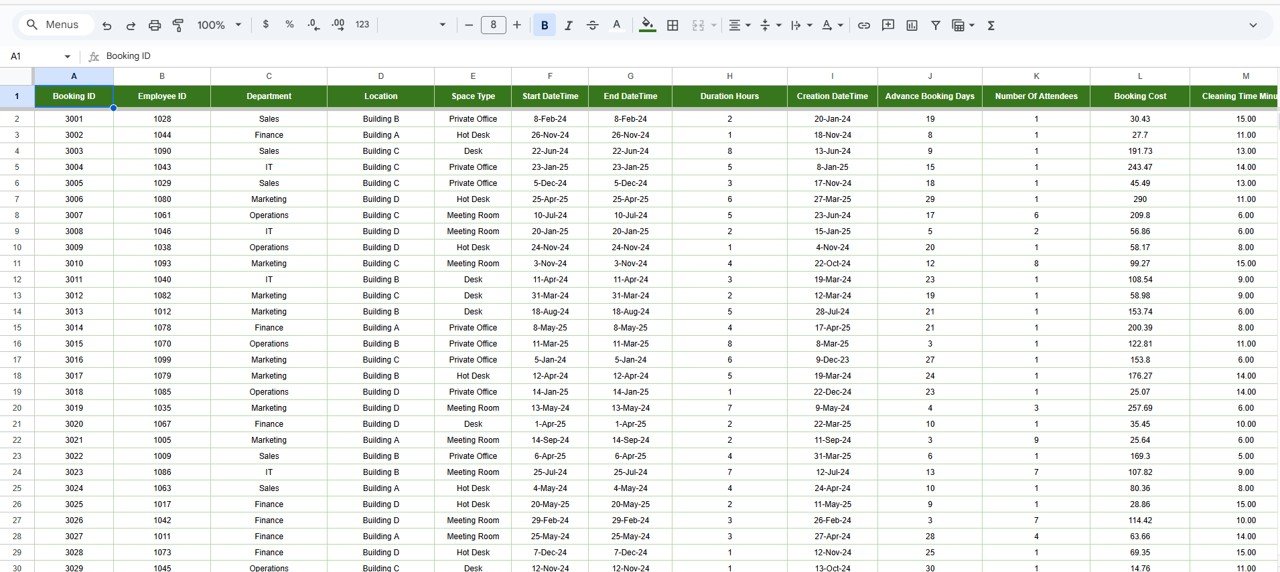
Data Sheet Tab
The Data Sheet is where all raw booking data is entered or imported.
Typical Columns Include:
- Booking ID
- Department
- Location
- Space Type
- Booking Date
- Booking Cost
- Revenue
- Attendees
- Advance Booking Days
- Preparation Time (Minutes)
- User Rating
Once this data is entered, all KPIs and charts update automatically across the dashboard.
This automation ensures the dashboard always reflects the most recent and accurate information.
Click to Buy Space Utilization Dashboard in Google Sheets
Advantages of the Space Utilization Dashboard in Google Sheets
-
Centralized Data View: Combine all space booking and utilization data in one place.
-
Interactive Visuals: Understand performance instantly through charts and summaries.
-
Operational Efficiency: Identify underused or overbooked spaces quickly.
-
Improved Planning: Track booking patterns to forecast demand accurately.
-
Cost Optimization: Compare costs and revenue by space type to manage budgets.
-
User Feedback Integration: Monitor satisfaction ratings to improve space quality.
-
Real-Time Collaboration: Multiple users can edit and view simultaneously.
-
Fully Customizable: Add or modify KPIs and charts as per your organization’s needs.
Opportunities for Improvement
While this dashboard is powerful, it can be enhanced further with automation and integration:
-
Automated Data Import: Connect Google Forms or booking systems directly to the Data Sheet.
-
Email Alerts: Notify teams about upcoming bookings or underutilized spaces.
-
Booking Calendar View: Integrate a visual booking calendar using Google Apps Script.
-
Heat Map Visualization: Show high-usage spaces with color-coded intensity maps.
-
Budget Comparison Feature: Include variance analysis between forecasted and actual costs.
-
Mobile Optimization: Use Google Looker Studio to create a mobile-friendly version.
Best Practices for Using the Dashboard
Click to Buy Space Utilization Dashboard in Google Sheets
-
Update Data Weekly: Keep the data sheet current to ensure accurate reporting.
-
Standardize Categories: Use consistent labels for departments, locations, and space types.
-
Use Conditional Formatting: Automatically highlight low ratings or long preparation times.
-
Monitor Trends: Compare month-over-month utilization rates to track improvements.
-
Limit Access: Protect sensitive cost or revenue data using Google Sheets permissions.
-
Conduct Monthly Reviews: Discuss dashboard insights in facility meetings to make data-driven decisions.
Conclusion
The Space Utilization Dashboard in Google Sheets provides an intelligent, data-driven way to manage and optimize organizational spaces. With visual insights on bookings, costs, attendance, and satisfaction, it helps you make informed decisions, reduce inefficiencies, and improve user experiences.
Whether you’re managing a corporate office, training facility, or coworking environment, this dashboard offers a cost-effective, visual, and collaborative tool to enhance productivity and optimize space utilization.
Frequently Asked Questions (FAQ)
Click to Buy Space Utilization Dashboard in Google Sheets
1. Can I track utilization across multiple buildings or cities?
Yes. You can add a “Location” column and filter results accordingly.
2. Can the dashboard calculate space occupancy rates?
Yes. Add an “Occupancy %” field by comparing attendees to total capacity.
3. Can I automate booking data collection?
Yes. You can link a Google Form or booking software to the Data Sheet.
4. Does the dashboard update automatically?
Yes. When you update the Data Sheet, all charts and KPIs refresh in real time.
5. Can multiple team members use it simultaneously?
Absolutely. Google Sheets supports real-time collaboration with edit and view permissions.
Visit our YouTube channel to learn step-by-step video tutorials
Youtube.com/@NeotechNavigators
Watch the step-by-step video Demo: