In the world of sports, performance is everything. Whether you are managing a professional team, organizing a fitness program, or overseeing a sports-related business, tracking Key Performance Indicators (KPIs) is crucial to ensuring continuous improvement. A Sports KPI Dashboard in Google Sheets is a versatile and effective tool for managing and monitoring the performance of athletes, teams, or organizations. This guide will help you understand how to set up a sports KPI dashboard in Google Sheets, list important KPIs, and optimize its usage.
What is a Sports KPI Dashboard in Google Sheets?
A Sports KPI Dashboard is a dynamic tool that allows teams, coaches, and sports managers to track the key metrics related to performance, fitness, and overall team progress. The dashboard provides a snapshot of important KPIs in one place, making it easier to assess the team’s progress, set new goals, and identify areas for improvement.
The Sports KPI Dashboard in Google Sheets can be customized to track different metrics such as player performance, fitness levels, game statistics, and team efficiency. By using Google Sheets, the dashboard is accessible in real-time and can be shared with multiple stakeholders, ensuring everyone is on the same page.
Key Features of the Sports KPI Dashboard in Google Sheets
This Sports KPI Dashboard in Google Sheets comes with several features that make it a powerful tool for tracking and analyzing sports performance. Below are the main features of this dashboard:
1. Dashboard Sheet Tab
The Dashboard Sheet Tab serves as the main tab where all KPI information is displayed. Here’s what it offers:
-
MTD Actual vs. Target: The dashboard shows Month-to-Date (MTD) actual performance and compares it to the set targets.
-
YTD Actual vs. Target: Similarly, Year-to-Date (YTD) performance data is displayed and compared against the targets.
-
Previous Year Data: The dashboard allows you to compare current data with the previous year’s performance to assess growth or decline.
-
Conditional Formatting: Arrows and color-coded indicators help visualize performance comparisons quickly, showing whether performance is improving or declining.

Click to buy Sports KPI Dashboard in Google Sheets
2. KPI Trend Sheet Tab
In this sheet, you can select a specific KPI from a dropdown menu (located in Range C3). It displays:
-
KPI Group: The group to which each KPI belongs (e.g., Fitness, Game Stats, Player Performance).
-
Unit of Measurement: The unit used for tracking the KPI (e.g., Points, Distance, Goals).
-
KPI Type: Whether the KPI is considered “Lower is Better” or “Upper is Better.”
-
Formula & Definition: The formula used to calculate the KPI and its definition to help clarify the purpose and calculation.

Click to buy Sports KPI Dashboard in Google Sheets
3. Actual Number Sheet Tab
This tab allows you to input the actual performance data for each KPI:
-
YTD and MTD Data: You can enter actual numbers for both Year-to-Date (YTD) and Month-to-Date (MTD).
-
Dynamic Date Selection: You can change the month for analysis by modifying the month in Range E1, which automatically updates all data.

4. Target Sheet Tab
In this sheet, you can input the target numbers for each KPI, both for MTD and YTD. This allows you to compare actual performance against the pre-set goals.

Click to buy Sports KPI Dashboard in Google Sheets
5. Previous Year Number Sheet Tab
This tab is used to input the previous year’s data. By comparing current and past performance, you can analyze progress and trends over time.

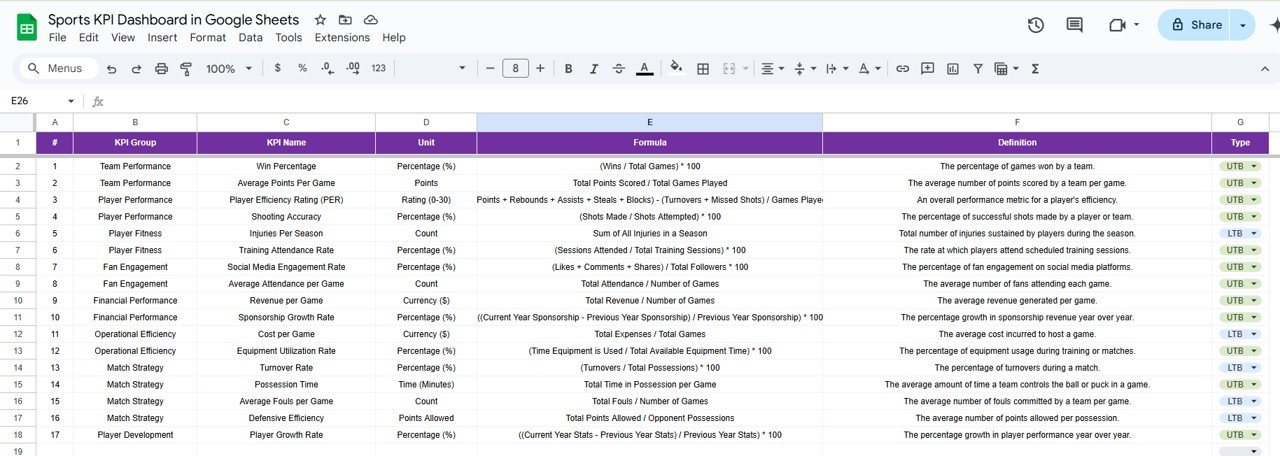
6. KPI Definition Sheet Tab
This sheet provides comprehensive details about each KPI:
-
KPI Name: The name of the KPI being tracked.
-
KPI Group: The category to which the KPI belongs.
-
Unit of Measurement: The unit used for tracking.
-
Formula & Definition: The formula used to calculate the KPI and a brief explanation of its importance.
Click to buy Sports KPI Dashboard in Google Sheets
Advantages of Using a Sports KPI Dashboard in Google Sheets
Implementing a Sports KPI Dashboard in Google Sheets offers several advantages, both in terms of efficiency and performance monitoring. Here are some key benefits:
- Real-Time Data Tracking; Google Sheets enables real-time updates, ensuring that performance data is always up-to-date. This is especially crucial in sports where performance metrics need to be monitored continuously.
- Collaboration and Accessibility: The cloud-based nature of Google Sheets makes it easy for teams, coaches, and managers to access the dashboard from any location. Team members can work collaboratively on the same sheet, ensuring everyone is aligned and has access to the same data.
- Cost-Effective Solution; Google Sheets is free and doesn’t require additional software or subscription fees. This makes it a cost-effective solution for sports teams or organizations that need to track KPIs but are working within a budget.
- Customizability: The dashboard is highly customizable. You can modify the KPIs, formulas, and layout to fit the specific needs of your team or sport, making it a versatile tool for a variety of sports and athletic activities.
- Data Visualization: With built-in conditional formatting, charts, and graphs, Google Sheets allows you to visualize your KPIs effectively. This helps to identify trends, areas for improvement, and successful performance quickly and easily.
Opportunities for Improvement in the Sports KPI Dashboard
While the Sports KPI Dashboard in Google Sheets is a powerful tool, there are always ways to improve and enhance its functionality:
- Integration with Other Data Sources: Integrating the dashboard with other data sources such as wearable devices, fitness trackers, or game statistics platforms could automate data input. This would save time and reduce errors associated with manual data entry.
- Advanced Reporting and Automation: Automating report generation and email notifications can help keep stakeholders informed without having to manually generate reports. By utilizing Google Apps Script, you can schedule reports to be sent to coaches, players, and management on a regular basis.
- More Advanced Data Analysis: For teams that need advanced performance analysis, integrating Google Sheets with Power BI or Google Data Studio can add more advanced analytical features, such as predictive modeling and in-depth trend analysis.
- Mobile Accessibility: While Google Sheets is accessible on mobile devices, creating a mobile-friendly version of the dashboard would improve user experience. A simplified version of the dashboard optimized for small screens could make it easier for coaches and players to check their KPIs on-the-go.
Best Practices for Using a Sports KPI Dashboard
Click to buy Sports KPI Dashboard in Google Sheets
To make the most out of your Sports KPI Dashboard, here are some best practices to follow:
- Define Clear and Relevant KPIs: Before setting up your dashboard, ensure that the KPIs you are tracking are relevant to the specific goals of your sports team or organization. Focus on measurable metrics that provide actionable insights.
- Regularly Update the Data: Consistency is key when using any dashboard. Make sure to update the actual numbers regularly to ensure your data remains accurate and relevant. You can set a schedule to input the data monthly or after every game or practice session.
- Use Conditional Formatting Wisely: Conditional formatting makes it easy to spot trends at a glance. Use color codes (e.g., green for good performance, red for poor performance) to quickly visualize the data and make it easier to understand.
- Set Realistic Targets: Setting clear, realistic targets for each KPI is crucial. Ensure that the targets are achievable and aligned with the team’s capabilities and objectives. Unrealistic goals can lead to frustration and disengagement.
- Track Both Individual and Team Performance: If possible, track both individual athlete performance and overall team performance. This will give you insights into how each player contributes to the team and where improvements are needed.
Frequently Asked Questions (FAQs)
1. What are KPIs in Sports?
KPIs in sports are measurable values used to assess an athlete’s performance, a team’s progress, or a sports organization’s success. Common KPIs include goals, assists, win/loss ratios, fitness levels, and many others.
2. How Do I Set Up a Sports KPI Dashboard in Google Sheets?
You can set up a sports KPI dashboard by first defining the KPIs you want to track. Then, create a Google Sheet with various tabs to input actual data, set targets, and visualize progress. Use formulas and conditional formatting to compare data.
3. Can I Use This Dashboard for Any Sport?
Yes, the Sports KPI Dashboard in Google Sheets can be customized for any sport. You can track performance metrics such as points scored in basketball, goals in soccer, laps completed in swimming, or distance run in track events.
4. How Can I Improve the Accuracy of My KPIs?
To improve accuracy, make sure to input data regularly, use reliable sources for your data, and automate data collection when possible. This reduces human error and ensures that the data is current.
5. Can I Share My Sports KPI Dashboard with My Team?
Yes, Google Sheets allows you to share the dashboard with your team. You can grant different access levels to ensure that players, coaches, and managers can view or edit the data as necessary.
Conclusion
Click to buy Sports KPI Dashboard in Google Sheets
A Sports KPI Dashboard in Google Sheets is an invaluable tool for tracking and improving performance in any sports team or organization. By utilizing the features of Google Sheets, such as real-time collaboration, data visualization, and customization, coaches, managers, and athletes can stay on top of their goals and make data-driven decisions. Whether you are tracking individual performance, team efficiency, or overall progress, a KPI dashboard can help you achieve success both on and off the field.
Visit our YouTube channel to learn step-by-step video tutorials
Youtube.com/@NeotechNavigators