
In today’s competitive sports industry, success depends on more than just performance on the field. From player statistics and fan engagement to sponsorship revenue and operational efficiency, every decision must be backed by accurate data. Managing these metrics manually can be challenging and time-consuming — that’s where the Sports League KPI Dashboard in Google Sheets comes in.
This ready-to-use, interactive dashboard allows sports managers, analysts, and coaches to measure, monitor, and visualize critical performance indicators (KPIs) across multiple areas of league operations. Whether you are tracking team performance, audience growth, or financial results, this dashboard provides everything you need to make smarter, data-driven decisions — all within Google Sheets.
Click to buy Sports League KPI Dashboard in Google Sheets
What Is a Sports League KPI Dashboard?
A Sports League KPI Dashboard is a visual performance-tracking tool built in Google Sheets. It consolidates key performance indicators (KPIs) — such as win rate, player efficiency, ticket sales, and social media reach — into one central location. This makes it easy for sports organizations to analyze trends, identify strengths and weaknesses, and set achievable performance targets.
Unlike complex business-intelligence software, Google Sheets offers a cost-effective, cloud-based, and collaborative solution. Teams can update data in real time, view performance insights instantly, and access reports from any device.
Key Features of the Sports League KPI Dashboard in Google Sheets
This dashboard template consists of six well-structured worksheets, each designed for a specific purpose. Let’s explore each one in detail.
Dashboard Sheet Tab — The Main Control Center
The Dashboard sheet serves as the heart of this KPI system.
It displays all major metrics and performance indicators in a clean, visual layout.
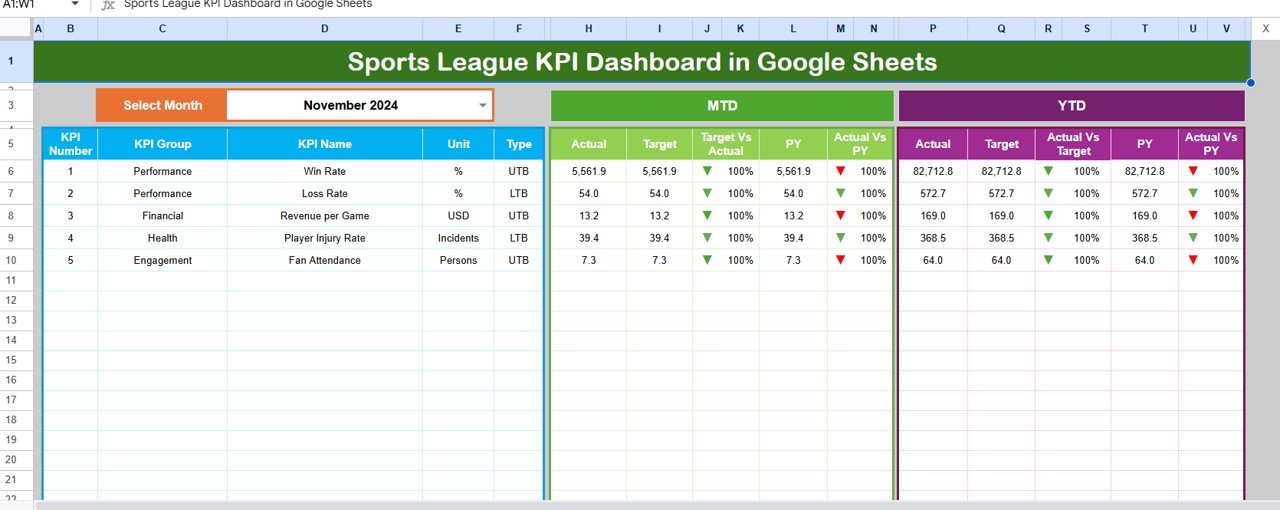
Key highlights include:
- A Month selector (cell D3) that allows you to choose any month from a drop-down list. Once you make a selection, all dashboard values automatically update.
- Month-to-Date (MTD) and Year-to-Date (YTD) performance views for every KPI.
- Target vs. Actual and Previous Year (PY) vs. Actual comparisons.
- Conditional formatting that uses up/down arrows to highlight whether the performance has improved or declined.
This sheet acts as a quick snapshot for management and coaches to track progress, identify shortfalls, and take corrective actions promptly.
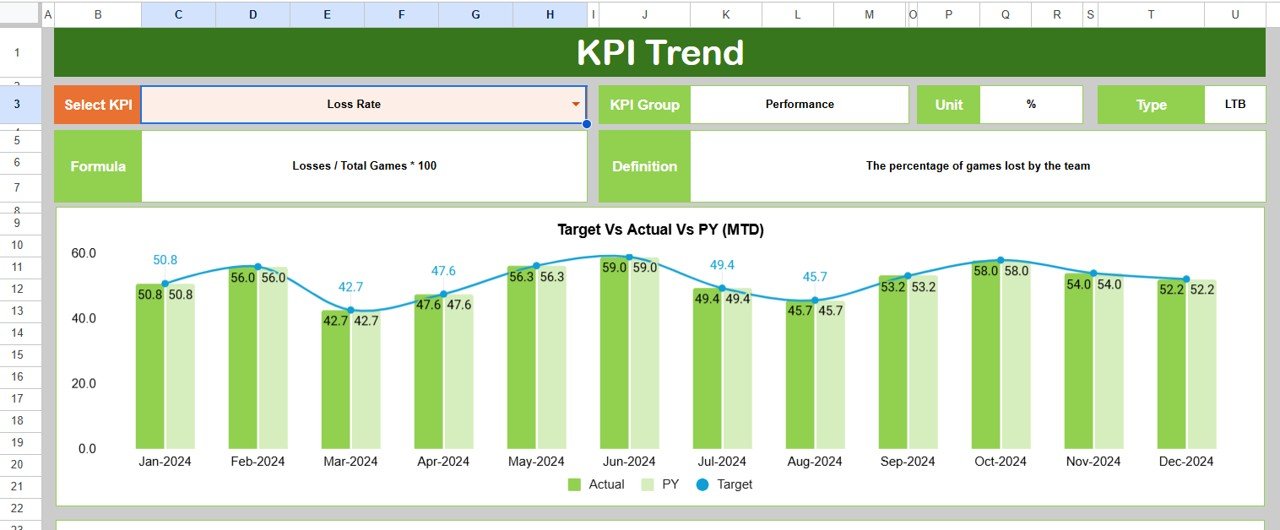
Trend Sheet Tab — Analyze KPI Performance Over Time
The Trend sheet allows you to dive deeper into the performance of specific KPIs.
Main features:
- A drop-down menu in cell C3 to select a KPI.
- Display of essential KPI details such as:
- KPI Group
- Unit
- Type of KPI (e.g., Upper the Better (UTB) or Lower the Better (LTB))
- Formula used to calculate the KPI
- Definition for clarity
- Dynamic MTD and YTD trend charts for Actual, Target, and Previous Year data.
This section transforms raw data into meaningful visuals, making it easy to track performance fluctuations and identify long-term patterns.
Click to buy Sports League KPI Dashboard in Google Sheets
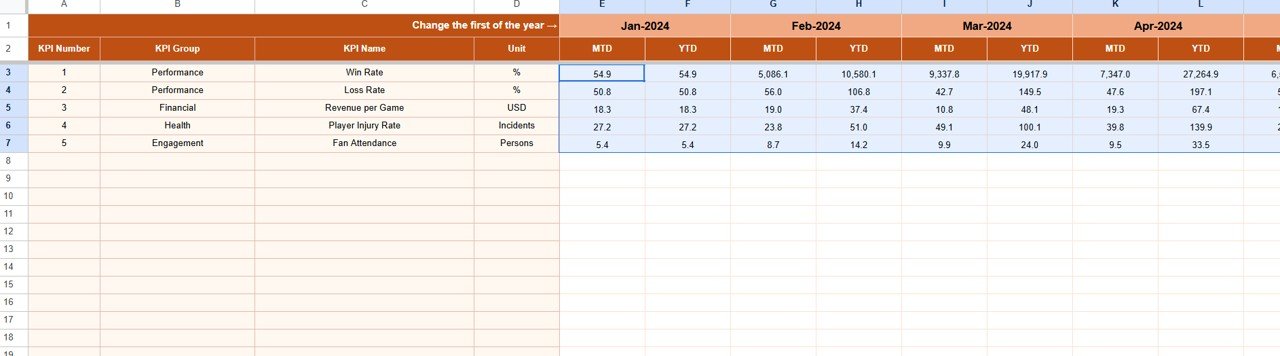
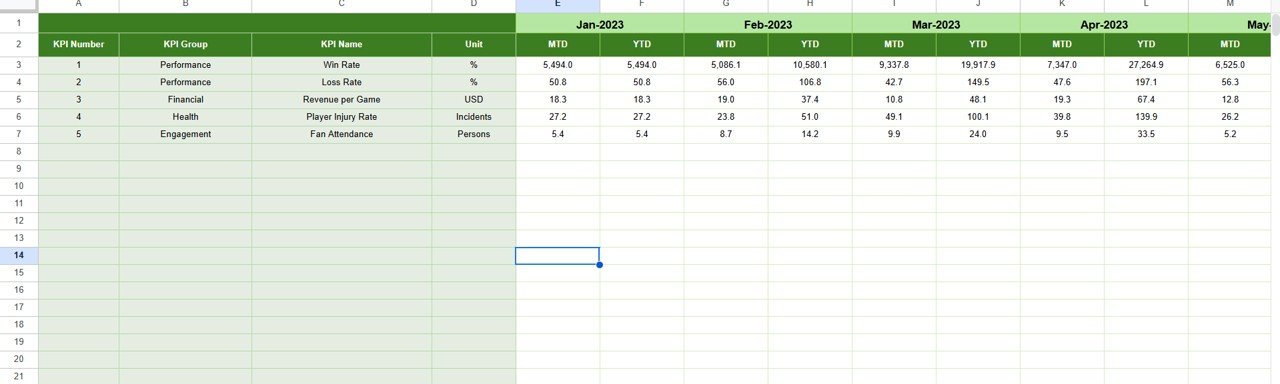
Actual Numbers Input Sheet — Enter Real Performance Data
This sheet is where you record the actual performance data.
Features:
- Enter MTD and YTD figures for each month.
- Use cell E1 to define the first month of the year. The dashboard automatically adjusts calculations and trends based on that setting.
- Data entered here feeds directly into the main dashboard and trend charts.
By keeping actual data updated monthly, your dashboard will always reflect real-time performance insights.
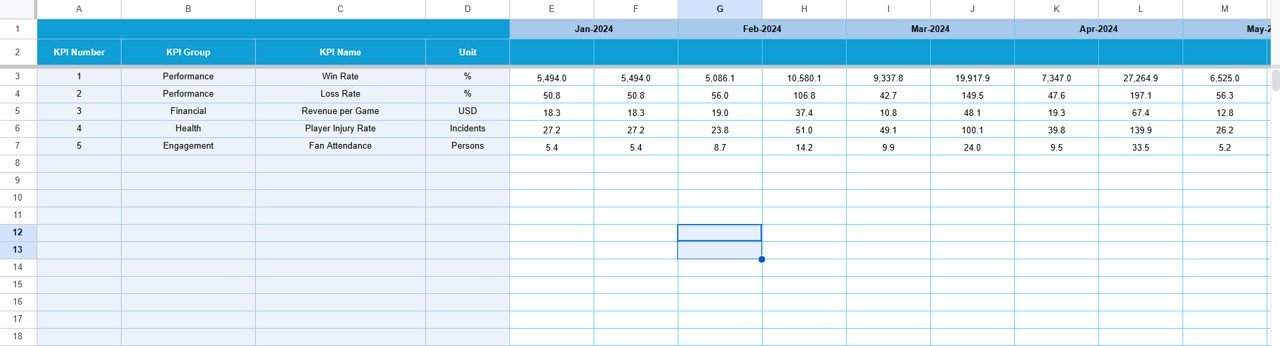
Target Sheet Tab — Set and Monitor Goals
The Target sheet helps you establish performance benchmarks.
Key points:
- Record MTD and YTD target values for each KPI across all months.
- Easily compare Actual vs. Target data on the Dashboard sheet.
- Identify whether your teams are achieving, exceeding, or falling short of set objectives.
With this setup, you can transform raw goals into measurable KPIs that promote accountability and progress tracking.
Click to buy Sports League KPI Dashboard in Google Sheets
Previous Year Numbers Sheet — Compare Historical Performance
This worksheet contains Previous Year (PY) data to help assess year-over-year performance.
Why it’s useful:
- Enables comparison of current results with last year’s data.
- Helps identify consistent performers and areas needing improvement.
- Adds valuable context for trend analysis and long-term planning.
By understanding how your league performed last year, you can better evaluate growth and set realistic future goals.
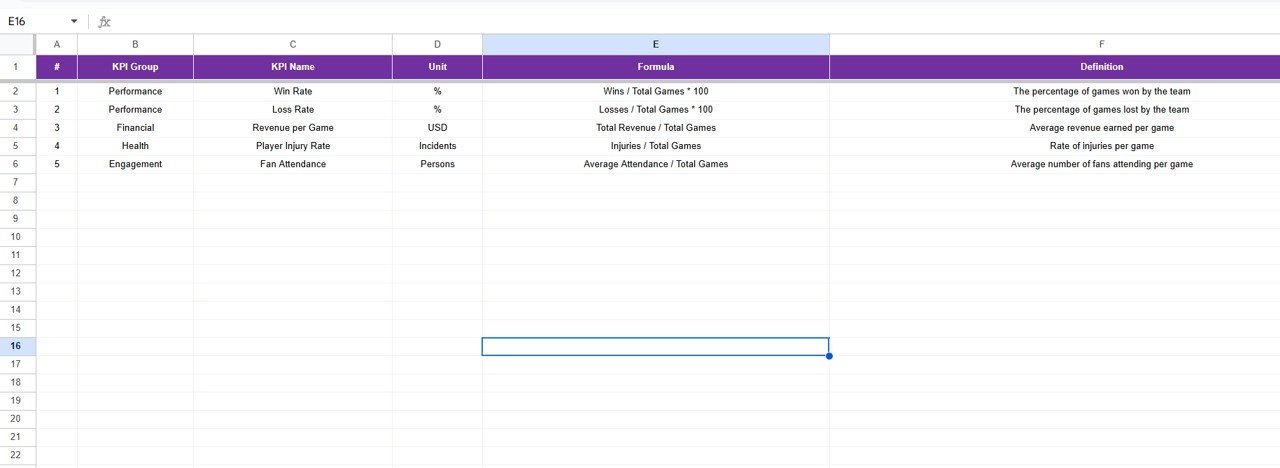
KPI Definition Sheet — Build KPI Clarity and Consistency
This sheet acts as the master reference for all KPIs used in the dashboard.
It includes columns for:
- KPI Name
- KPI Group
- Unit of Measurement
- Formula
- KPI Definition
Clear documentation ensures that every stakeholder — from management to analysts — interprets KPIs the same way. This eliminates confusion and strengthens decision-making accuracy.
Why Use Google Sheets for Sports KPI Tracking?
While specialized analytics software exists, Google Sheets provides multiple advantages for sports data management:
- Accessibility: Update and view data anytime, anywhere.
- Collaboration: Multiple users can work simultaneously.
- Cost-Efficiency: No need for expensive BI tools.
- Customization: Modify charts, KPIs, and visuals easily.
- Integration: Link with Google Forms, Data Studio, or APIs for automation.
Advantages of Sports League KPI Dashboard in Google Sheets
The benefits of using this tool extend beyond convenience — it can completely transform the way your league operates.
1. Real-Time Decision-Making
Instant updates mean coaches and managers can take immediate actions when metrics fall below expectations.
2. Centralized Performance Tracking
All KPIs — from player stats to ticket sales — are available in one unified system.
3. Enhanced Strategic Planning
By comparing Actual vs. Target and Year-over-Year data, you can create more realistic performance goals.
4. Goal Alignment
Each department (coaching, marketing, finance, etc.) can align its KPIs with the league’s overall objectives.
5. Time-Saving Automation
Automatic calculations, charts, and conditional formatting reduce manual reporting efforts.
6. Scalability
The template works for small local leagues or large multi-team associations alike.
How to Use the Sports League KPI Dashboard Effectively
Follow these steps to make the most out of your dashboard:
- Define Your KPIs Clearly
Start by identifying what matters most — wins, sponsorship revenue, audience engagement, etc. - Input Accurate Data
Enter actual, target, and historical numbers in their respective sheets. - Use the Month Selector (D3)
Quickly switch between months to see MTD and YTD comparisons. - Analyze the Trend Charts
Look for performance fluctuations and investigate the causes. - Update Regularly
Keep your data current to ensure accurate analysis and reporting. - Share Insights with the Team
Use built-in Google sharing to present results to stakeholders or coaching staff.
Best Practices for the Sports League KPI Dashboard
To get maximum value from your dashboard, follow these proven best practices:
- Use consistent units for KPIs (e.g., goals per match, revenue in USD).
- Update the “Actual” and “Target” sheets monthly to maintain accuracy.
- Limit KPIs to a manageable number (10–15) for clarity.
- Review trends quarterly to identify growth or decline patterns.
- Combine qualitative and quantitative KPIs (e.g., fan satisfaction and ticket sales).
- Leverage conditional formatting for quick visual insights.
- Document KPI definitions clearly to avoid misinterpretation.
- Backup regularly to prevent accidental data loss.
These practices ensure your dashboard remains reliable, insightful, and easy to maintain throughout the season.
Use Cases of the Sports League KPI Dashboard
This dashboard fits multiple use cases within the sports ecosystem:
For League Administrators
Monitor overall league performance, sponsorship ROI, and fan engagement levels.
For Team Coaches
Track player stats, team wins, and performance trends across the season.
For Marketing Managers
Measure ticket sales, merchandise performance, and social-media reach.
For Finance Teams
Compare budgeted vs. actual expenditures and forecast future investments.
For Media Partners
Use KPI visuals to report highlights and progress during live broadcasts or press releases.
These metrics can be modified according to your sport, region, and league structure.
Why Sports Organizations Love This Dashboard
Sports professionals appreciate this dashboard for its simplicity, functionality, and real-time insights.
Some user feedback examples:
- “It made our season analysis 70% faster.”
- “Now I can visualize which players need more focus instantly.”
- “It’s perfect for monthly board presentations.”
When you use this dashboard, you gain not just a data tool — but a strategic advantage.
Conclusion
The Sports League KPI Dashboard in Google Sheets brings clarity, control, and insight to every aspect of sports management. From tracking performance to identifying growth opportunities, this tool empowers teams and organizations to make smarter, data-driven decisions.
With six powerful sheets — Dashboard, Trend, Actual, Target, Previous Year, and KPI Definition — it provides everything you need to measure success, drive accountability, and continuously improve performance.
In short, if you want to transform your league’s data into actionable insights, this is the perfect starting point.
Frequently Asked Questions (FAQs)
- What is the purpose of a Sports League KPI Dashboard?
It helps sports managers monitor, analyze, and improve league performance by tracking critical metrics like wins, fan engagement, and financial outcomes in one place.
- Can I customize the KPIs in the dashboard?
Yes. You can easily modify the KPI Definition sheet to add, remove, or adjust KPIs based on your league’s priorities.
- How often should I update the dashboard?
You should update it monthly for MTD and YTD data to ensure accurate insights.
- Do I need technical skills to use it?
No. The dashboard is user-friendly and requires only basic Google Sheets knowledge.
- Can multiple users work on it simultaneously?
Yes. Google Sheets supports real-time collaboration, allowing multiple team members to update and review data together.
- What sports can this dashboard be used for?
It works for any sport — football, basketball, cricket, hockey, baseball, or even eSports — since KPIs are fully customizable.
- Can I integrate this dashboard with other tools?
Absolutely. You can connect it with Google Forms, Google Data Studio, or APIs for automation and advanced visualization.
Visit our YouTube channel to learn step-by-step video tutorials