When working with data in Google Sheets, one of the essential statistical measures you’ll often need is Standard Deviation of a Sample in Sheets. This measure helps you understand the spread or variation of data points around the mean (average). In this blog post, we will guide you on how to calculate the standard deviation of a sample using Sheets, with a practical example.
What is Standard Deviation and Why is it Important?
Before diving into the calculations, it’s important to understand standard deviation. Simply put, it’s a measure of how much individual data points deviate from the average. The smaller the standard deviation, the closer the data points are to the mean. On the other hand, a larger standard deviation indicates a greater spread of values.
In most real-world scenarios, we deal with a sample of data, rather than the entire population. For this reason, we use sample standard deviation rather than population standard deviation, as it provides a more accurate measure when working with limited data.
Calculating Standard Deviation of a Sample in Google Sheets
Let’s break it down step by step. Below, we will show you how to calculate the sample standard deviation in Google Sheets, using a simple set of data related to employee heights.
Step 1: Prepare Your Data
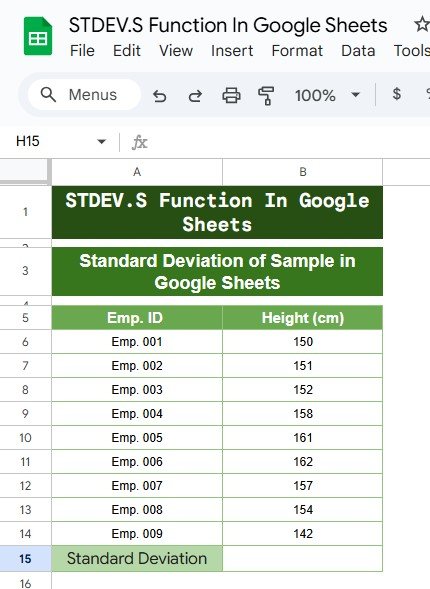
First, you need to enter the data into Google Sheets. For this example, we’ll use the heights of a group of employees, represented as follows:

Step 2: Use the Standard Deviation Formula
To calculate the sample standard deviation in Sheets, you can use the formula STDEV.S. This function calculates the standard deviation based on a sample, which is exactly what we want in this case.
Here’s how to use the formula:
Select an empty cell where you want the result to appear.
Type the following formula:
=STDEV.S(B6:B14)
In this example, B6:B14 refers to the range of cells containing the height data (from 150 to 142).
Step 3: View the Result
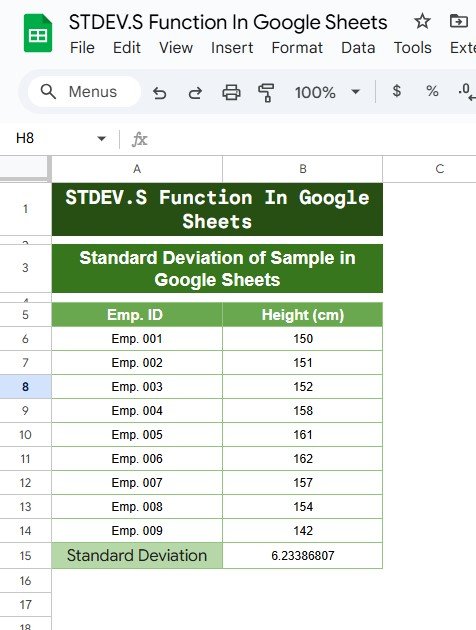
After entering the formula, press Enter to calculate the standard deviation. For this dataset, the standard deviation is:
Standard Deviation: 6.23

Step 4: Interpret the Result
The result shows that the standard deviation of the sample heights is 6.23 cm. This means that, on average, each employee’s height deviates from the mean height by approximately 6.23 cm.
A higher deviation would indicate that the heights are more spread out from the mean, whereas a lower value would suggest that the heights are more closely clustered around the average.
Why Use STDEV.S Instead of STDEV.P?
Google Sheets offers two functions related to standard deviation: STDEV.S and STDEV.P. Here’s when to use each:
- STDEV.S: This function is used for calculating the standard deviation of a sample (a subset of the population). Since most of the time you are working with sample data, this is the more commonly used function.
- STDEV.P: This function calculates the standard deviation for the entire population. If you have data that represents the whole population (not just a sample), you would use this function instead.
In our case, since we’re working with a sample of employee heights (not the entire population of employees), we’ll use STDEV.S.
Example of How to Use Standard Deviation in Real Life
Let’s say you’re working with a company and you want to analyze employee heights to see how consistent the team is in terms of physical stature. By calculating the standard deviation, you can see whether there’s a wide range of heights or if most employees are quite similar in height. This can help in designing more comfortable office furniture, choosing clothing sizes for team uniforms, or simply understanding the variation within a team.
Recap: The Formula and Output
To summarize, here’s the data we used and the formula we applied:
=STDEV.S(B6:B14)
Output:
Standard Deviation: 6.23
Conclusion
Calculating the sample standard deviation in Sheets is easy once you know the right formula and how to apply it. By using the STDEV.S function, you can quickly analyze the variation in any dataset, whether it’s employee heights, sales figures, test scores, or any other numerical data.
Visit our YouTube channel to learn step-by-step video tutorials
Youtube.com/@NeotechNavigators


