In this article, we introduce the Startup Growth KPI Dashboard in Google Sheets, which is a ready-to-use template designed to track key performance indicators (KPIs) for your startup’s growth. Below are the key features of this KPI Dashboard:
This dashboard consists of 6 worksheets:
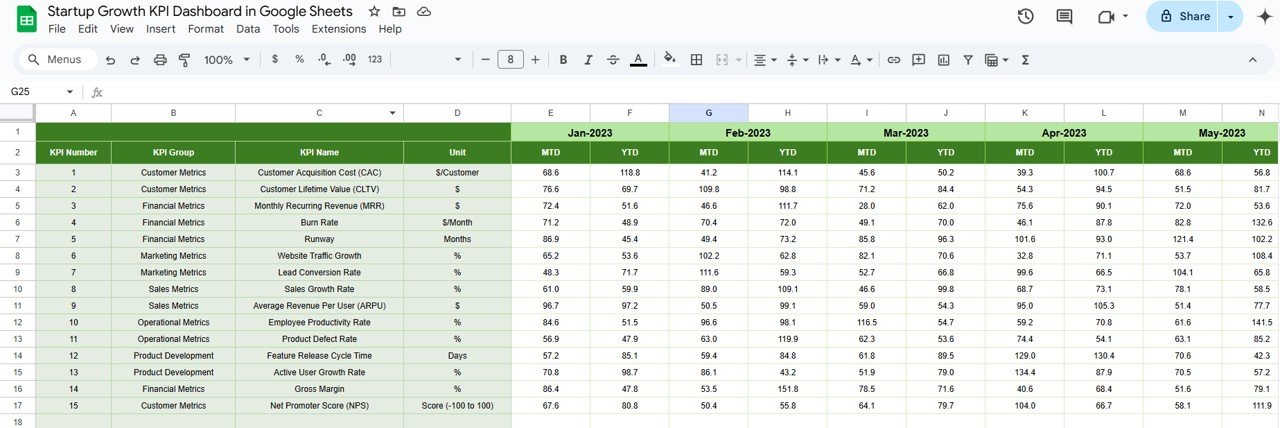
1. Dashboard Sheet Tab
The Dashboard Sheet serves as the main view for monitoring all of your KPIs. Here’s what you can expect:
-
Month Selection: Select the month from a dropdown in Range D3. The entire dashboard will update with the selected month’s data.
-
MTD (Month-to-Date) Metrics: Shows the actual numbers, target values, and previous year data, with comparisons using Target vs Actual and PY vs Actual, along with conditional formatting for trends (up and down arrows).
-
YTD (Year-to-Date) Metrics: Similar to MTD, this section shows the actual numbers, targets, and previous year data, with the same comparison metrics and conditional formatting.

Click to buy Startup Growth KPI Dashboard in Google Sheets
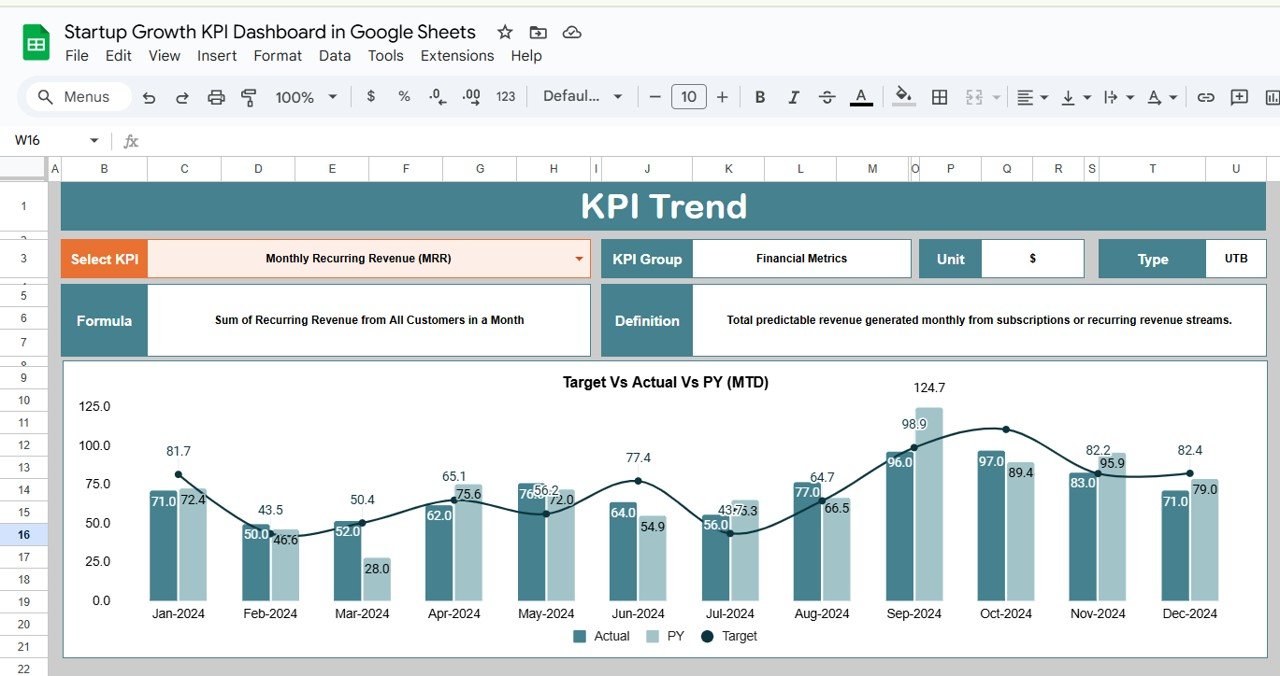
2. KPI Trend Sheet Tab
In the KPI Trend Sheet, you can:
-
Select a specific KPI name from the dropdown in Range C3.
-
View the KPI Group, Unit, Type of KPI (whether “Lower the Better” or “Upper the Better”).
-
See the Formula for each KPI and its Definition.
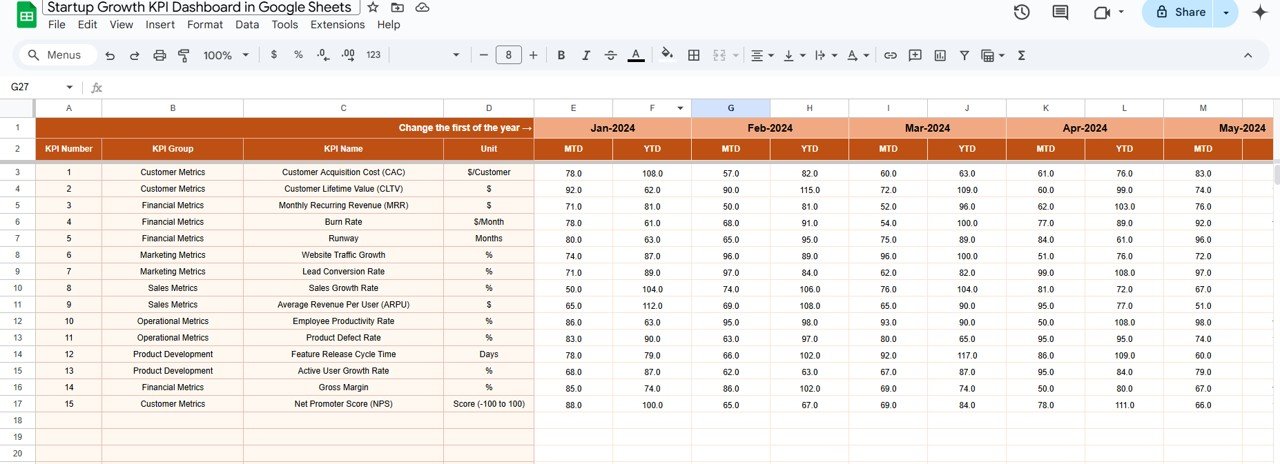
3. Actual Numbers Sheet Tab
This tab is where you input the actual data for both MTD and YTD performance. To update the dashboard, select the first month of the year in Range E1 and enter the data for that month.
Click to buy Startup Growth KPI Dashboard in Google Sheets
4. Target Sheet Tab
In this tab, you enter the target values for each KPI for the MTD and YTD periods. These values are compared to the actual numbers to calculate the performance.
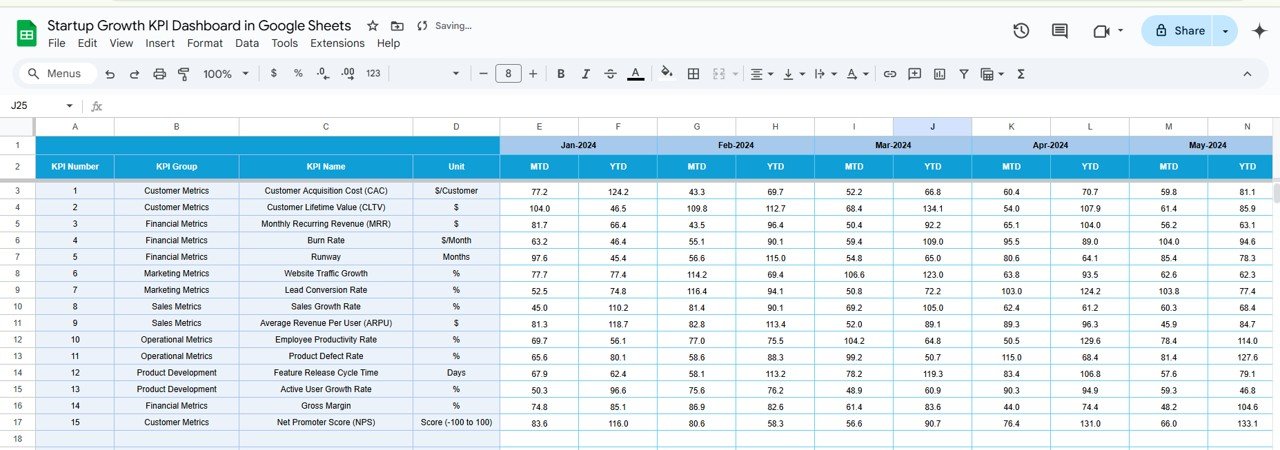
5. Previous Year Numbers Sheet Tab
Here, input the data from the previous year. This allows you to track year-over-year changes and trends for each KPI.
Click to buy Startup Growth KPI Dashboard in Google Sheets
6. KPI Definition Sheet Tab
This tab contains detailed information about each KPI, including the KPI Name, KPI Group, Unit, Formula, and Definition. This ensures that everyone understands the KPIs being tracked and their relevance to the startup’s growth.

Advantages of Using a Startup Growth KPI Dashboard
A Startup Growth KPI Dashboard provides several significant benefits for founders and managers. These include:
-
Real-Time Monitoring: The dashboard allows you to track key metrics in real-time, helping you spot trends, opportunities, and challenges as they occur. This enables quick decision-making to keep the business on track.
-
Data-Driven Decisions: With clear visualizations of important KPIs, the dashboard empowers decision-makers to base their strategies on actual performance data rather than assumptions or guesswork.
-
Performance Evaluation: By tracking metrics such as Customer Acquisition Cost (CAC), Monthly Recurring Revenue (MRR), and Churn Rate, you can assess the effectiveness of marketing campaigns, sales strategies, and customer retention efforts.
-
Strategic Growth Insights: The dashboard enables you to analyze growth patterns, identify high-performing areas, and pinpoint underperforming segments. This helps in optimizing efforts toward scaling the business.
-
Increased Accountability: With transparent KPI tracking, team members are more likely to focus on meeting their targets, improving efficiency, and maintaining motivation as they can see their contributions in real time.
Opportunities for Improvement in Startup Growth KPI Dashboards
Click to buy Startup Growth KPI Dashboard in Google Sheets
While the Startup Growth KPI Dashboard is a powerful tool, there are several areas where you can enhance its effectiveness:
-
Integration with Other Tools: Integrating the dashboard with other tools such as CRM systems, accounting software, or project management platforms can automate data input, ensuring more accurate and up-to-date information.
-
Advanced Data Visualization: You can enhance the dashboard by adding interactive visualizations such as heatmaps, trend lines, or geo-location maps to make insights even more actionable and visually appealing.
-
Mobile Accessibility: Optimizing the dashboard for mobile devices ensures that startup managers and teams can monitor KPIs and track performance on the go, no matter where they are.
-
Incorporating Predictive Analytics: By adding predictive metrics such as projected revenue growth or forecasted churn, you can anticipate potential issues and make proactive adjustments to your strategy.
-
User Feedback and Customization: Allowing users to customize the dashboard by adding their own preferred KPIs or metrics helps ensure that the dashboard is tailored to the specific needs of your business.
Best Practices for Creating and Using a Startup Growth KPI Dashboard
To make the most out of the Startup Growth KPI Dashboard, follow these best practices:
-
Define Clear KPIs: Make sure that the KPIs you track are directly aligned with your startup’s strategic goals. This ensures that the data you’re gathering will have actionable value.
-
Update Data Regularly: Ensure the dashboard is updated with fresh data regularly (ideally daily or weekly) to reflect the most current performance and avoid outdated insights.
-
Focus on the Most Impactful Metrics: Avoid overwhelming your dashboard with too many KPIs. Focus on a few high-impact metrics that provide real insights into the areas that matter most for your startup’s growth.
-
Consistency in Data Entry: Ensure that data entry is consistent across all the sheets (MTD, YTD, Target, Actuals, etc.). Inconsistent data can lead to skewed insights and poor decision-making.
-
Review and Adjust Periodically: Regularly review the performance of your startup by evaluating the KPIs and comparing actual data against targets. Adjust your strategies if necessary to keep the growth trajectory on track.
-
Encourage Team Collaboration: Since the dashboard allows multiple users to view and update data, use this to foster collaboration among team members. Everyone can stay aligned and take collective ownership of the startup’s performance.
Conclusion
Click to buy Startup Growth KPI Dashboard in Google Sheets
The Startup Growth KPI Dashboard in Google Sheets is an excellent tool for tracking the key metrics that drive the growth of your startup. By using the provided KPIs, you can gain valuable insights into your customer acquisition, revenue growth, employee productivity, and more. The dashboard is highly customizable, allowing you to input your data and make decisions based on real-time insights.
Visit our YouTube channel to learn step-by-step video tutorials
Youtube.com/@NeotechNavigators
Watch the step-by-step video Demo:
Click to buy Startup Growth KPI Dashboard in Google Sheets