In the competitive world of subscription-based businesses, having a clear view of your key performance indicators (KPIs) is essential for managing growth, retention, and overall performance. The Subscription Business KPI Dashboard in Google Sheets provides a powerful, ready-to-use tool for tracking all relevant metrics in your subscription business. From monitoring new subscribers to tracking churn rates, this dashboard helps you gain insights that drive business decisions. In this article, we will explore the key features of the dashboard, the KPIs tracked, and how it can benefit your subscription-based business.
What is the Subscription Business KPI Dashboard?
The Subscription Business KPI Dashboard in Google Sheets is a template designed to help businesses that offer subscription services track their key performance metrics. The dashboard provides an overview of essential KPIs such as Monthly Recurring Revenue (MRR), Churn Rate, Customer Acquisition Cost (CAC), and more. It offers real-time insights and allows users to track their progress, compare against targets, and analyze year-over-year performance.
This template contains multiple sheets to organize data and metrics, helping businesses stay on top of their subscription-based operations.
Key Features of the Subscription Business KPI Dashboard
The dashboard consists of six key worksheets that provide a comprehensive view of your business metrics:
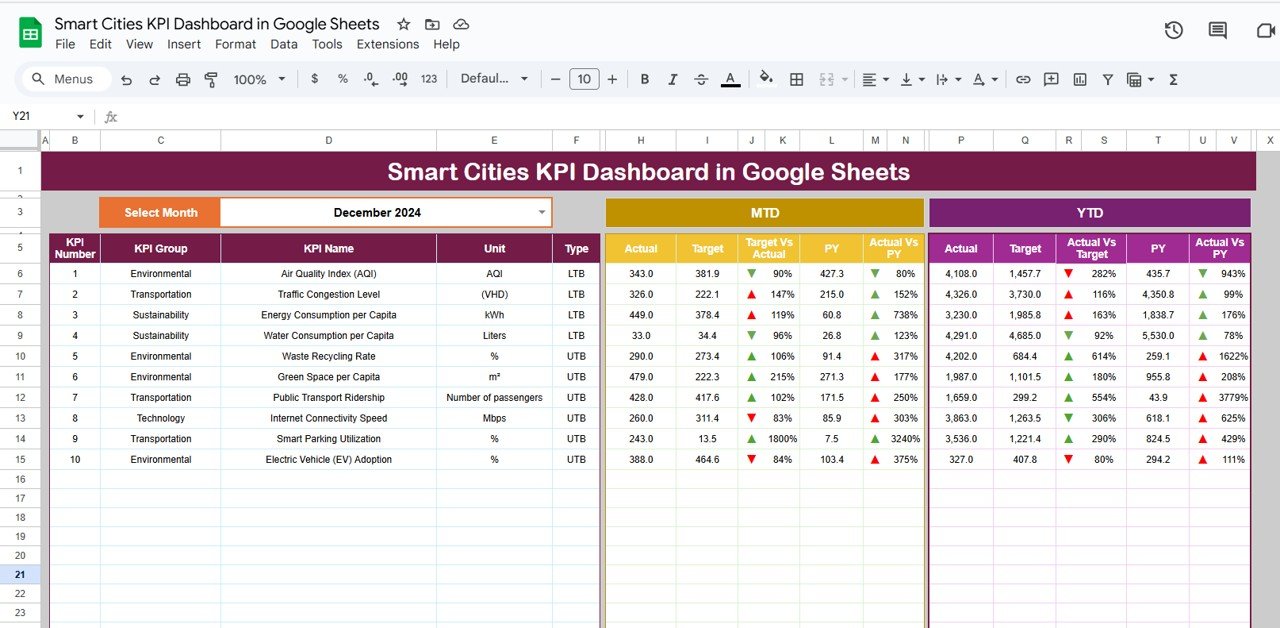
1. Dashboard Sheet Tab
This is the main sheet where all KPIs are displayed. The key features include:
-
MTD (Month-to-Date) Actuals: Displays actual data for the current month.
-
YTD (Year-to-Date) Actuals: Displays cumulative data for the year.
-
Target vs. Actual: Compares actual performance with the set targets for MTD and YTD.
-
Previous Year (PY) vs. Actual: Compares the current year’s performance with that of the previous year, with conditional formatting (up/down arrows) for visual representation.
-
Month Selection: A dropdown (Range D3) allows you to select a month, and the entire dashboard updates accordingly.

Click to buy Subscription Business KPI Dashboard in Google Sheets
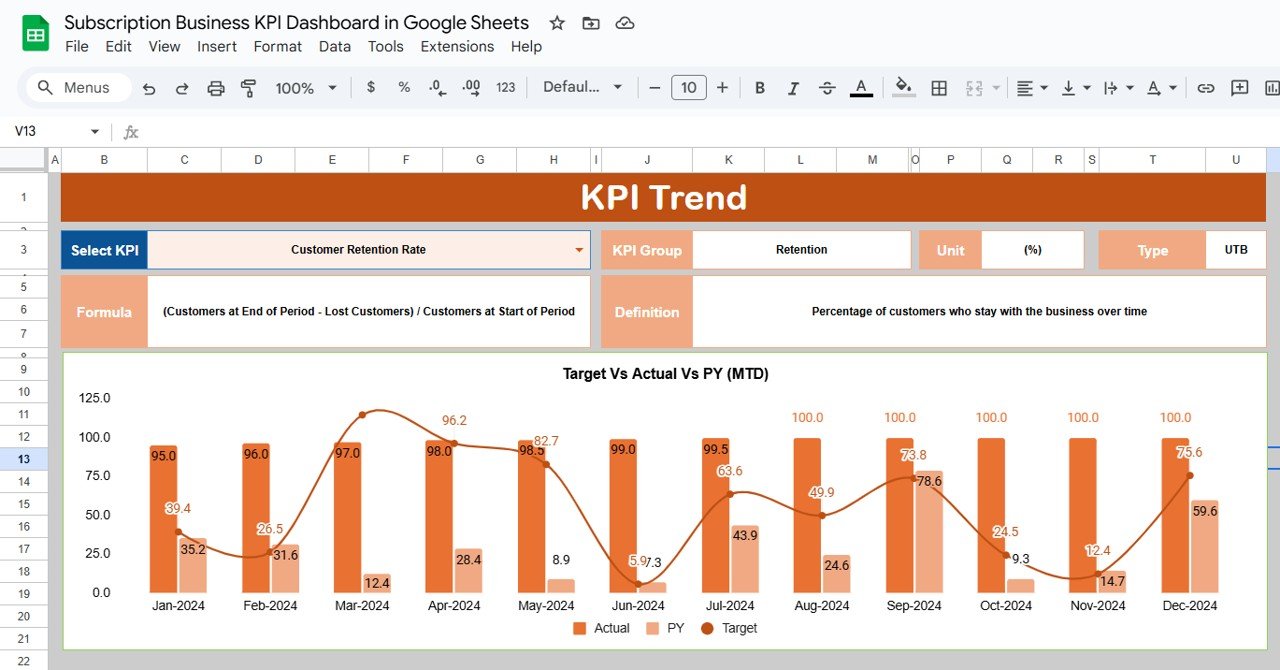
2. KPI Trend Sheet Tab
This sheet allows you to view trends for each selected KPI. Features include:
-
KPI Group: The category of the KPI (e.g., Revenue, Customer Acquisition).
-
Unit of KPI: The unit of measurement for the KPI (e.g., dollars, percentage).
-
KPI Type: Indicates whether the KPI is “Lower the Better” (LTB) or “Upper the Better” (UTB).
-
Formula: Provides the formula used to calculate the KPI.
-
Definition: A description of the KPI and its importance for business tracking.
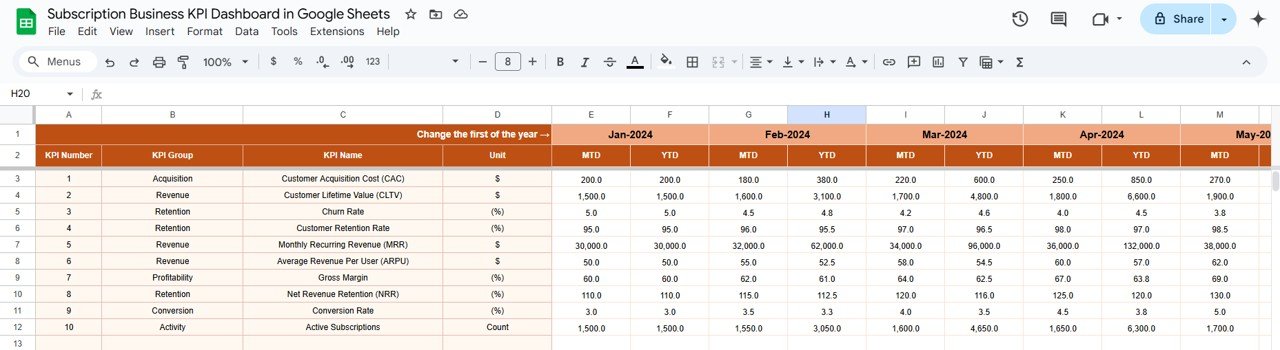
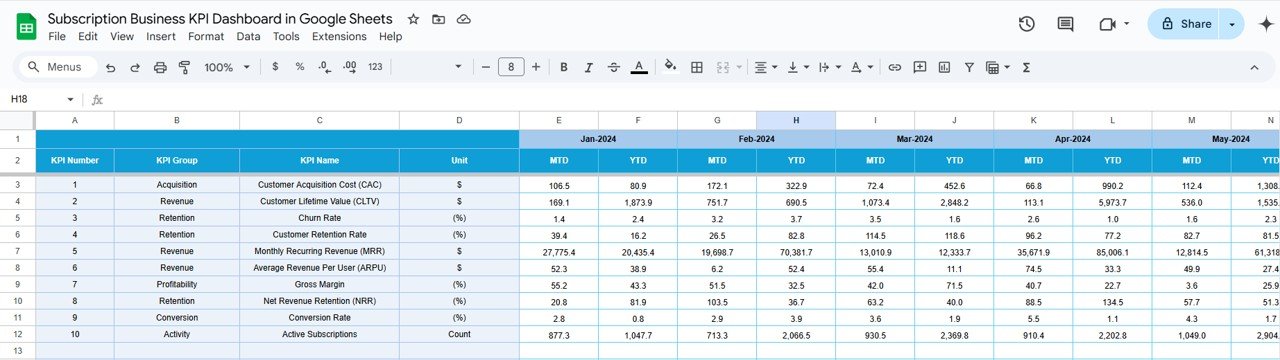
3. Actual Numbers Sheet Tab
This sheet is where you input the actual numbers for each KPI. You enter data for both MTD and YTD, and the dashboard will automatically update.
-
Month Selection: You can change the month in Range E1, and the data for that month will populate across the entire sheet.
Click to buy Subscription Business KPI Dashboard in Google Sheets
4. Target Sheet Tab
In the Target Sheet, you will enter the target numbers for each KPI. This includes both MTD and YTD targets.
-
Set Target Values: Enter the target values for each KPI to compare against the actual numbers.
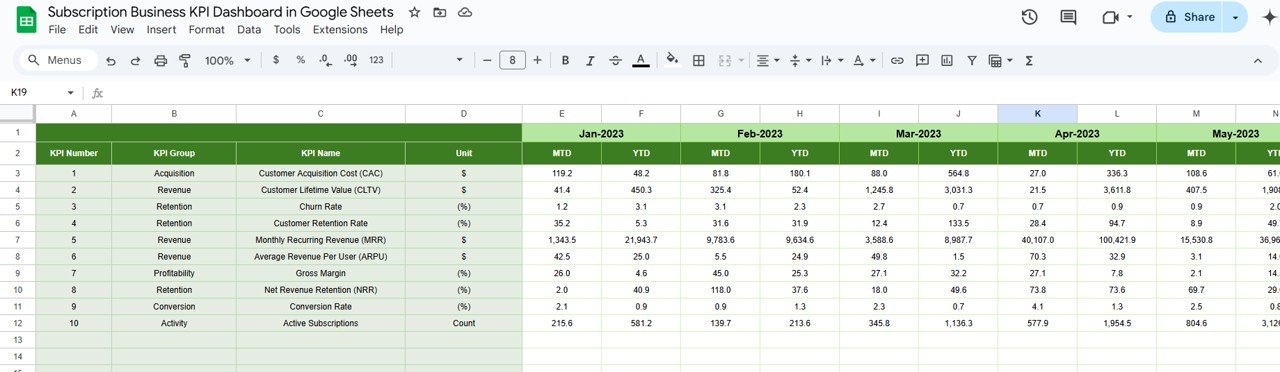
5. Previous Year Numbers Sheet Tab
This sheet captures data for the previous year, allowing you to compare year-over-year performance.
-
Input Past Year Data: Enter the previous year’s values for the same KPIs, ensuring consistency in comparison with the current year.
Click to buy Subscription Business KPI Dashboard in Google Sheets
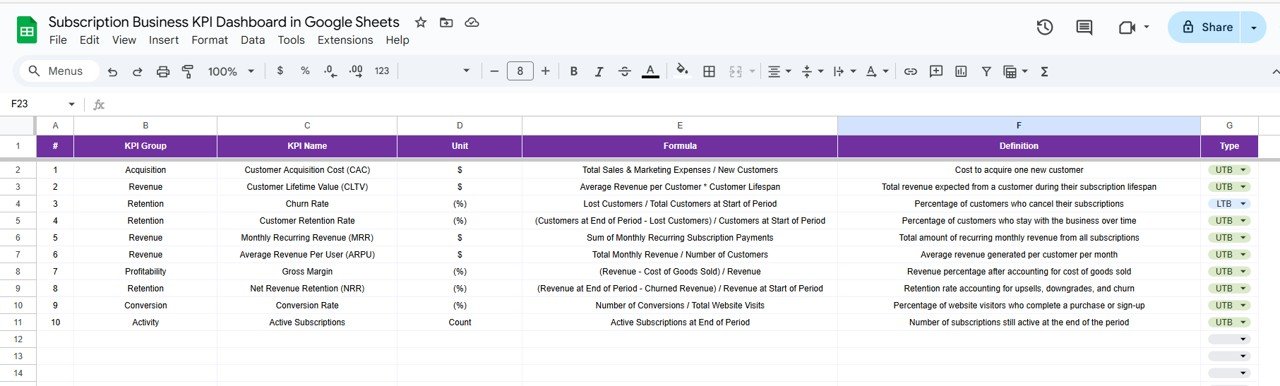
6. KPI Definition Sheet Tab
This sheet provides the definitions for each KPI, including:
-
KPI Name
-
KPI Group
-
Unit of Measurement
-
Formula
-
KPI Definition
This section ensures that each KPI is clearly understood by all users of the dashboard.
Advantages of Using the Subscription Business KPI Dashboard
Click to buy Subscription Business KPI Dashboard in Google Sheets
-
Real-Time Performance Monitoring: Track the health of your subscription business by comparing actual performance against targets.
-
Year-over-Year Comparisons: Easily compare current performance with previous year data, helping you assess long-term growth.
-
Data-Driven Decision Making: Leverage the data and insights from KPIs like MRR and CAC to make informed business decisions.
-
Customizable to Your Needs: Modify KPIs, formulas, and targets to suit your specific business model.
-
User-Friendly: The dashboard is easy to navigate with a simple interface that helps you quickly access and interpret data.
Best Practices for Using the Subscription Business KPI Dashboard
To get the most out of the Subscription Business KPI Dashboard in Google Sheets, follow these best practices:
-
Update Regularly: Enter actual values for MTD and YTD consistently to keep the data up to date.
-
Monitor Trends: Use the KPI Trend Sheet to identify patterns and adjust strategies as necessary.
-
Compare Against Targets: Regularly compare actual performance with set targets to assess whether you’re on track to meet your business goals.
-
Analyze Year-over-Year Performance: Use the Previous Year Numbers Sheet to assess long-term trends and growth.
-
Review and Adjust KPIs: Regularly review your KPIs and make adjustments as your business grows or your focus shifts.
Conclusion
Click to buy Subscription Business KPI Dashboard in Google Sheets
The Subscription Business KPI Dashboard in Google Sheets is an invaluable tool for managing the performance of subscription-based businesses. By tracking essential KPIs like Monthly Recurring Revenue (MRR), Churn Rate, and Customer Acquisition Cost (CAC), this dashboard provides a clear, data-driven overview of your business’s health. The ability to compare actual performance against targets and previous year data ensures that you can make informed decisions to drive growth and improve retention.
Frequently Asked Questions (FAQs)
1. What KPIs are most important for a subscription business?
Key KPIs for subscription businesses include MRR, Churn Rate, CAC, ARPU, and CLTV. These help track revenue, customer acquisition, and retention.
2. How do I update the dashboard?
To update the dashboard, input the latest actual data in the Actual Numbers Sheet and set the appropriate targets in the Target Sheet.
3. Can I customize the KPIs in the dashboard?
Yes, the dashboard is fully customizable. You can add, modify, or remove KPIs according to your business needs.
4. How often should I update the dashboard?
It’s recommended to update the dashboard on a monthly basis to track performance over time.
5. Can I use this dashboard for multiple subscription models?
Yes, you can modify the KPIs to track different types of subscriptions, whether they’re digital, physical products, or services.
Visit our YouTube channel to learn step-by-step video tutorials
Youtube.com/@NeotechNavigators
Watch the step-by-step video Demo:
Click to buy Subscription Business KPI Dashboard in Google Sheets