Subscription-based businesses grow only when they retain customers for a long time. Whether you run a SaaS platform, membership service, content subscription, OTT platform, e-learning system, or digital product business—retention matters more than anything else. Acquiring new users helps the business grow, but keeping your existing subscribers engaged decides its long-term success.Subscription Retention KPI Dashboard in Google Sheets
Because retention impacts revenue, customer lifetime value, churn, and future forecasting, you need a well-structured system to monitor all related KPIs. This is exactly why the Subscription Retention KPI Dashboard in Google Sheets becomes a powerful, ready-to-use tool for analytics and decision-making.Subscription Retention KPI Dashboard in Google Sheets
In this article, you will understand how the dashboard works, explore its worksheets, learn about all essential retention KPIs, and discover how businesses use it to improve long-term customer loyalty.Subscription Retention KPI Dashboard in Google Sheets
What Is a Subscription Retention KPI Dashboard in Google Sheets?
Click to Buy Subscription Retention KPI Dashboard in Google Sheets
A Subscription Retention KPI Dashboard is a structured reporting system that tracks key performance indicators related to customer retention, renewal behavior, churn, subscription growth, revenue stability, and customer engagement.
Because this dashboard is built in Google Sheets, it offers:
-
Real-time updates
-
Cloud accessibility
-
Easy collaboration
-
Zero installation
-
Instant sharing
-
Simple customization
It includes dynamic charts, drop-down filters, KPI calculation logic, and trend analysis to help you make accurate decisions.
Key Features of the Subscription Retention KPI Dashboard in Google Sheets
This dashboard includes six structured worksheets, each designed to help you track and analyze subscription performance.
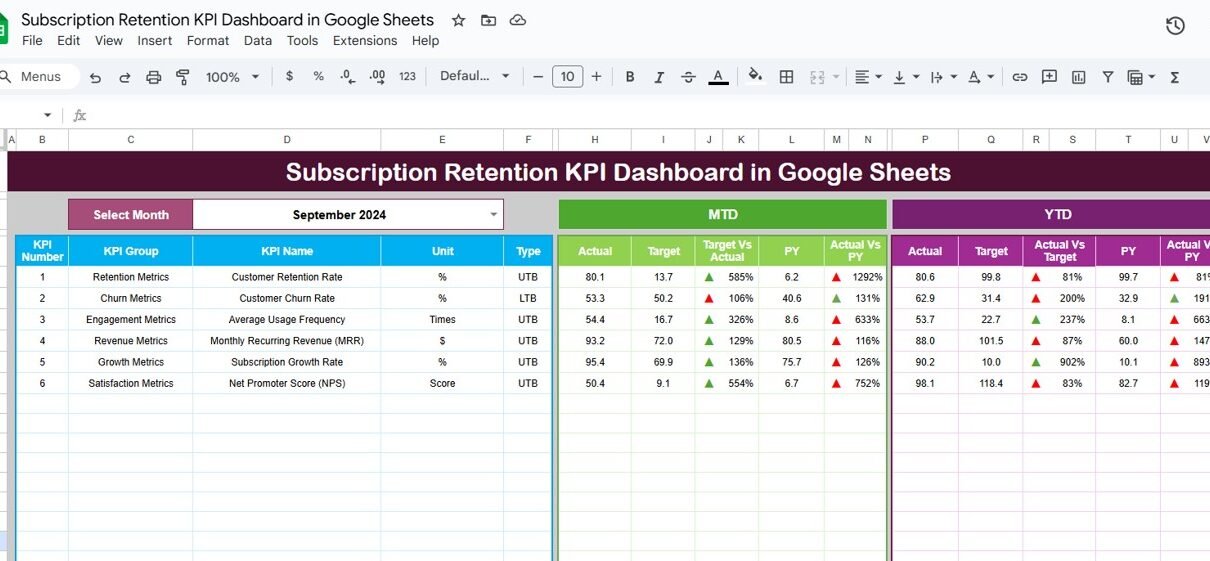
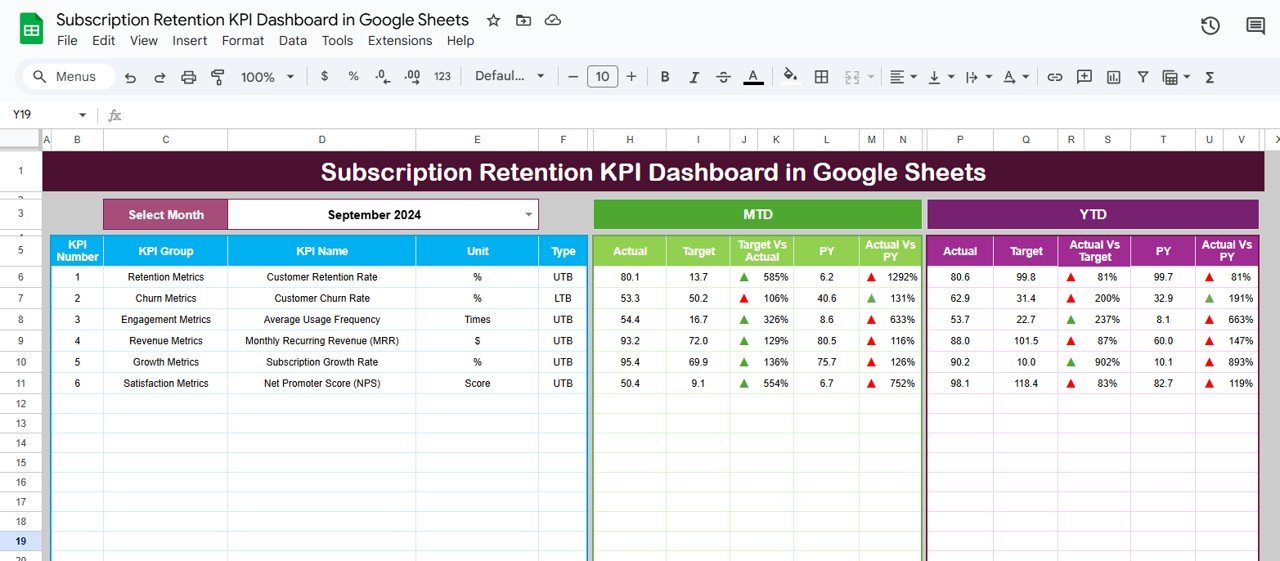
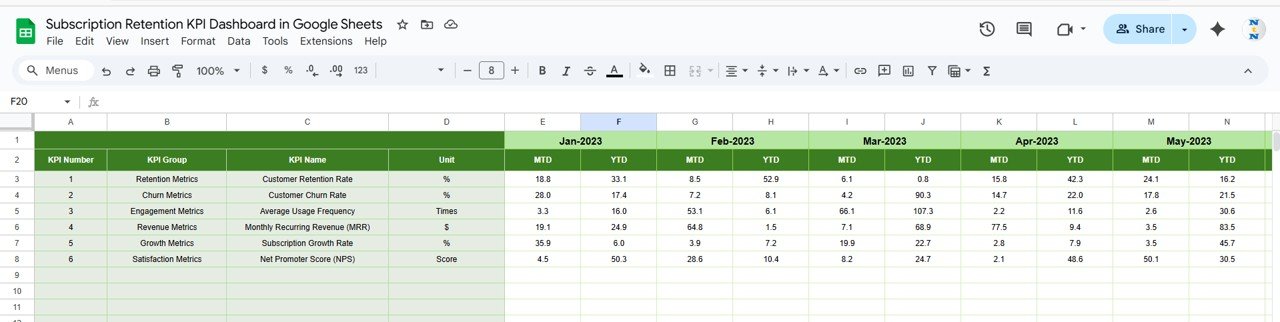
Dashboard Sheet Tab – Monthly & Yearly KPI Performance
This is the primary dashboard, and it updates the entire report automatically based on the selected month (cell D3).
On this page, you see:
Click to Buy Subscription Retention KPI Dashboard in Google Sheets
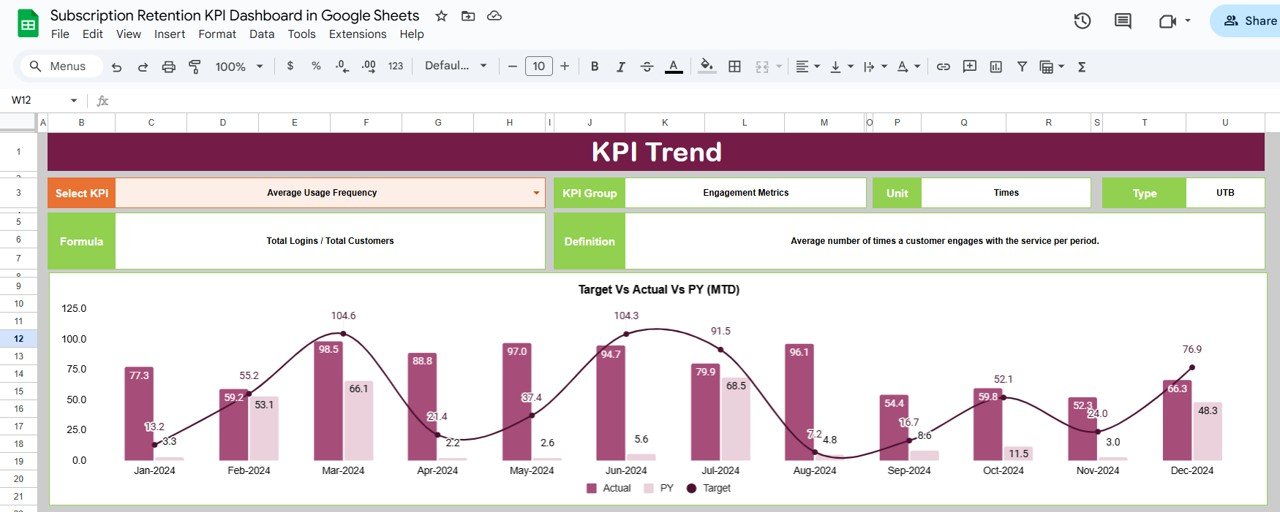
2. KPI Trend Sheet – Deep Performance Analysis
In this sheet, you select any KPI using the drop-down in cell C3.
Once selected, you will see:
-
KPI Group
-
KPI Unit
-
KPI Type (LTB or UTB)
-
KPI Formula
-
KPI Definition
This sheet also includes:
✔ MTD Trend Chart
Shows how the KPI moves month by month.
✔ YTD Trend Chart
Shows overall progress throughout the year.
This helps identify:
-
Seasonal patterns
-
Subscription peaks
-
Decline signals
-
Growth opportunities
Click to Buy Subscription Retention KPI Dashboard in Google Sheets
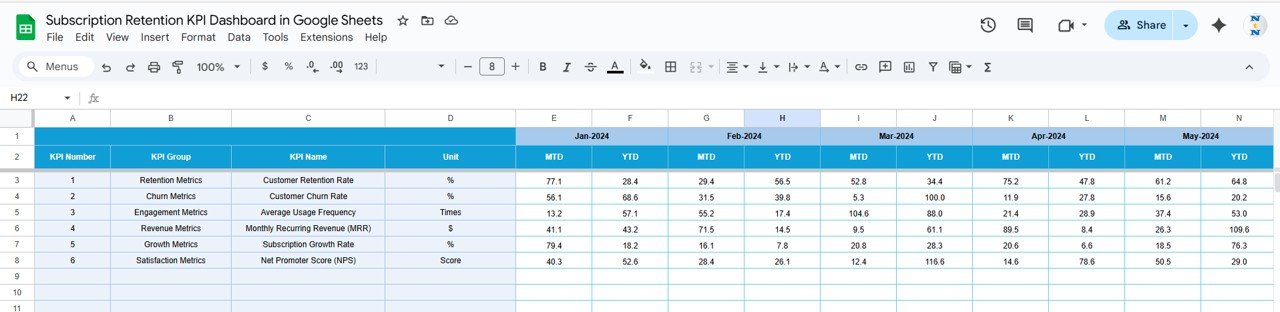
3. Actual Numbers Sheet – Enter MTD & YTD Performance
In this sheet, you enter:
-
Actual MTD numbers
-
Actual YTD numbers
-
First month of the year in cell E1
This sheet feeds data to the dashboard and trend pages.
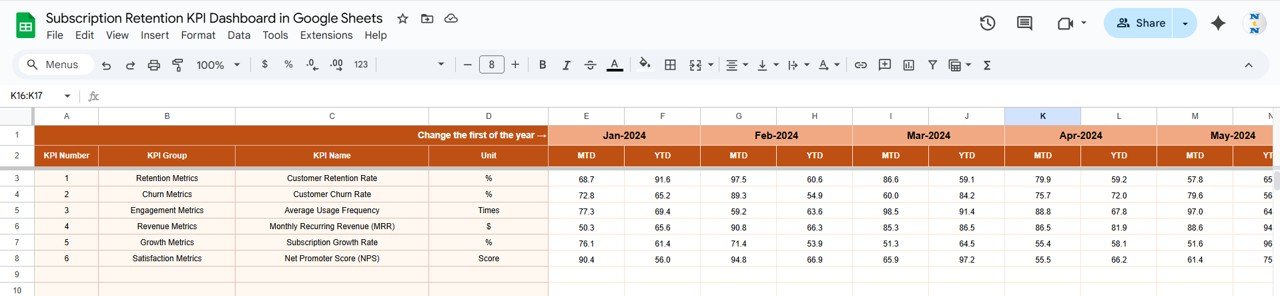
4. Target Sheet – Define KPI Targets
Here, you fill:
-
Monthly MTD targets
-
Monthly YTD targets
-
Expected performance for each KPI
Target setting ensures accurate performance evaluation.
Click to Buy Subscription Retention KPI Dashboard in Google Sheets
5. Previous Year Numbers Sheet
This sheet stores historic values for:
-
Previous Year MTD
-
Previous Year YTD
These numbers support all comparison charts and percentage insights.
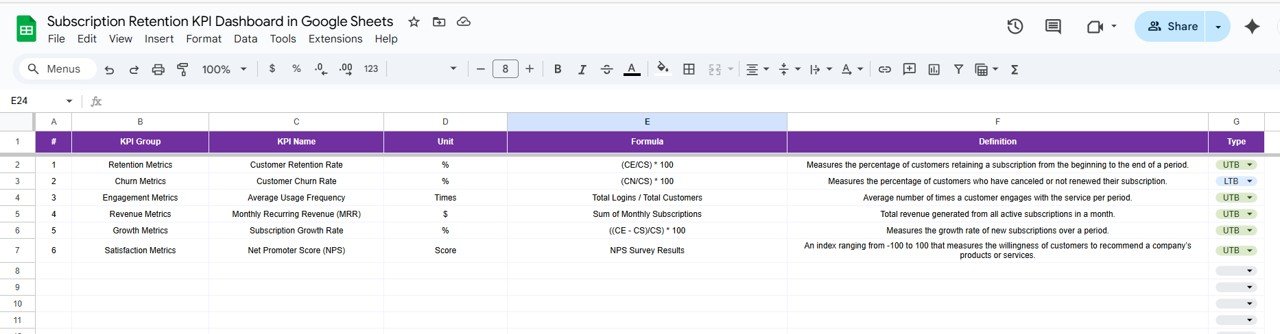
KPI Definition Sheet
This sheet stores all retention KPIs with:
-
KPI Name
-
KPI Group
-
Unit
-
Formula
-
KPI Definition
-
Type (Lower the Better or Upper the Better)
Click to Buy Subscription Retention KPI Dashboard in Google Sheets
Advantages of a Subscription Retention Dashboard
- Better decision-making: All KPIs appear clearly in charts and tables.
- Strong retention insights: Helps identify at-risk customers early.
- Predictive forecasting: YTD trends help forecast future subscriber growth.
- Higher revenue stability: Tracking churn reduces long-term financial losses.
- Easy collaboration: Google Sheets allows real-time teamwork.
- Customizable dashboard; Add new KPIs, modify formulas, or expand categories easily.
Best Practices for Using This Dashboard
-
Update MTD and YTD data regularly
-
Compare targets with actual performance monthly
-
Analyze MTD and YTD trends before making decisions
-
Prioritize churn KPIs to improve long-term retention
-
Review previous year numbers to track growth
-
Use conditional formatting to highlight KPIs
-
Maintain high-quality, clean data
Conclusion
Click to Buy Subscription Retention KPI Dashboard in Google Sheets
The Subscription Retention KPI Dashboard in Google Sheets is a complete retention monitoring system designed for subscription-driven businesses. It provides detailed insights into subscriber behavior, revenue stability, churn risks, renewal trends, and customer loyalty.
With six structured worksheets, a KPI trend view, monthly comparisons, and a strong KPI definition tab, this dashboard supports smarter decision-making and long-term business growth.
Whether you run a SaaS product, a membership plan, or any recurring revenue model—this dashboard helps you understand what drives retention and how to improve it.
Frequently Asked Questions (FAQs)
1. What does this dashboard track?
It tracks retention KPIs, churn, revenue stability, subscriber growth, and renewal performance.
2. Do I need advanced Google Sheets skills?
No. Basic spreadsheet knowledge is enough.
3. Can I add more KPIs?
Yes, the dashboard is fully customizable.
4. How often should I update data?
Monthly updates are recommended.
Visit our YouTube channel to learn step-by-step video tutorials
Youtube.com/@NeotechNavigators
Watch the step-by-step video Demo:
Click to Buy Subscription Retention KPI Dashboard in Google Sheets