Managing and improving the performance of a Substance Abuse Treatment Center requires precise tracking of key metrics such as admissions, relapse rates, counselor workload, patient recovery progress, and resource utilization. Without structured data analysis, decision-making can easily become reactive rather than proactive.
That’s where the Substance Abuse Center KPI Dashboard in Google Sheets comes in.
This ready-to-use, interactive tool enables healthcare administrators, center directors, and program managers to monitor and analyze all critical KPIs in one place. From patient engagement to treatment outcomes, the dashboard simplifies performance monitoring through dynamic charts, automatic calculations, and monthly trend visualizations.
In this detailed guide, you’ll discover everything about this Google Sheets dashboard—its structure, features, benefits, best practices, and frequently asked questions.
Click to buy Substance Abuse Center KPI Dashboard in Google Sheets
What Is a Substance Abuse Center KPI Dashboard in Google Sheets?
A Substance Abuse Center KPI Dashboard in Google Sheets is a smart, customizable analytics tool designed to track the most important performance indicators related to rehabilitation and addiction recovery operations.
It consolidates all relevant data—such as admission counts, therapy sessions, relapse incidents, counselor efficiency, and treatment success rates—into one interactive and visually rich dashboard.
Because it’s built entirely in Google Sheets, it offers real-time collaboration, easy data input, and powerful visualization without requiring complex software or coding skills.
The dashboard is ideal for:
- Treatment centers and rehabilitation facilities
- Non-profit organizations focused on recovery programs
- Healthcare administrators and program managers
- Policy researchers and data analysts studying addiction treatment outcomes
Structure of the Dashboard
The Substance Abuse Center KPI Dashboard consists of six interactive sheets, each serving a unique analytical purpose. Below is the breakdown of each tab and its role in performance tracking:
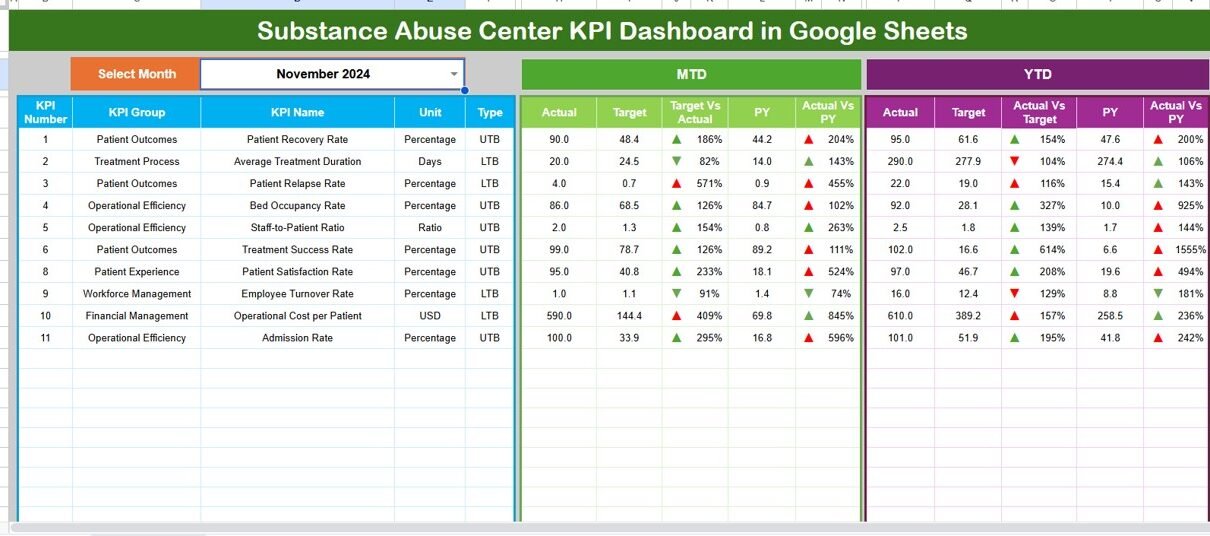
Dashboard Sheet Tab
This is the main interface where all the summarized KPIs are displayed.
It allows you to view Month-to-Date (MTD) and Year-to-Date (YTD) performance data in a clean, visual layout.
- A month selector (cell D3) enables you to pick a specific month.
- As soon as you choose a month, all charts and KPIs refresh automatically.
- You’ll see side-by-side comparisons of Actual vs. Target and Previous Year vs. Actual values.
- Conditional formatting uses up and down arrows (green for improvement, red for decline) to indicate performance trends.
- This sheet provides a snapshot of the center’s performance across all key metrics in real time.

Click to buy Substance Abuse Center KPI Dashboard in Google Sheets
Trend Sheet Tab
The Trend Sheet focuses on visual analysis over time.
Here, you can select a KPI name from a dropdown (cell C3) to view detailed trends.
Each chart displays:
- MTD and YTD trends for Actual, Target, and Previous Year data
- KPI details such as Group, Unit, Type (UTB – Upper the Better, LTB – Lower the Better), Formula, and Definition
- Easy interpretation of whether the KPI is improving or requires intervention
This page is ideal for performance review meetings, progress tracking, and identifying seasonal fluctuations or recurring issues.

Click to buy Substance Abuse Center KPI Dashboard in Google Sheets
Actual Numbers Input Sheet
This sheet is the foundation of your analysis.
Here, you input actual data for each KPI by month.
- You can select the starting month of the year from cell E1.
- Data can be entered for both MTD and YTD values.
- Once updated, these numbers automatically reflect across all analytical pages.
This sheet ensures that the dashboard remains accurate, transparent, and easy to maintain without needing technical expertise.

Click to buy Substance Abuse Center KPI Dashboard in Google Sheets
Target Sheet Tab
Every center operates with clear performance goals.
In this sheet, you can define monthly and yearly targets for each KPI.
Targets may include:
- Reduction in relapse rate (%)
- Increase in patient satisfaction (%)
- Improvement in counselor-to-patient ratio
- Reduction in average treatment duration
Once entered, these targets automatically feed into the dashboard and trend sheets, allowing for real-time Actual vs Target analysis.

Click to buy Substance Abuse Center KPI Dashboard in Google Sheets
Previous Year Numbers Sheet Tab
This sheet stores the baseline data from the previous year.
It helps you evaluate long-term growth and consistency.
- Enter the same metrics as you do in the current year (MTD and YTD).
- The dashboard automatically computes PY vs Actual differences with conditional indicators.
This sheet provides valuable context for understanding whether interventions are leading to sustainable improvement.

Click to buy Substance Abuse Center KPI Dashboard in Google Sheets
KPI Definition Sheet Tab
This sheet is the reference section of the dashboard.
It contains structured information about every KPI being tracked.
The table includes columns for:
- KPI Name
- KPI Group (e.g., Patient Outcomes, Operations, Staff Performance)
- Unit of Measurement
- Formula (used to calculate KPI value)
- KPI Definition
- Type (UTB – Upper the Better, LTB – Lower the Better)
This ensures every team member understands what each metric means, how it’s calculated, and why it matters.

Click to buy Substance Abuse Center KPI Dashboard in Google Sheets
Advantages of the Substance Abuse Center KPI Dashboard in Google Sheets
Using this dashboard provides several organizational, analytical, and operational benefits:
Real-Time Insights
As soon as you update the data, charts and summaries adjust instantly, giving you real-time performance snapshots without waiting for manual reports.
2Better Decision-Making
Visual comparisons between Actual vs Target and Previous Year vs Actual empower management to make evidence-based decisions.
Enhanced Accountability
Each KPI is linked to a responsible department or team, ensuring that everyone understands their contribution to organizational goals.
Easy Collaboration
Since the dashboard is hosted in Google Sheets, multiple stakeholders (administrators, clinicians, analysts) can collaborate simultaneously from anywhere.
Cost-Effective Solution
Unlike commercial software, this Google Sheets solution is affordable and requires no licensing or technical setup.
Visual Clarity
Conditional formatting, color-coded indicators, and trend charts simplify performance communication for non-technical users.
Opportunities for Improvement
While the dashboard is powerful, every system can benefit from periodic enhancement.
Here are some improvement opportunities:
- Automation: Integrate Google Forms or App Script for automated data input.
- Data Validation: Add drop-downs and validation rules to minimize human errors.
- Predictive Analysis: Use Google Sheets’ built-in forecasting functions to predict future KPIs like relapse rates or occupancy.
- Drill-Down Reporting: Introduce clickable filters for department- or counselor-level views.
- Integration: Link the dashboard with EMR (Electronic Medical Record) systems for automatic data synchronization.
How to Use the Dashboard Effectively
To get the most value from the Substance Abuse Center KPI Dashboard:
- Input your baseline data into the Actual Numbers and Previous Year sheets.
- Set realistic monthly targets for each KPI.
- Review trends on the Trend sheet to identify performance patterns.
- Analyze dashboard charts during monthly or quarterly review meetings.
- Share insights with staff to align daily actions with organizational goals.
By following these steps, you’ll create a culture of data-driven decision-making across the center.
Best Practices for the Substance Abuse Center KPI Dashboard
Follow these best practices to maximize efficiency and maintain accuracy:
Keep Data Entry Consistent
Use standardized date formats and numeric units across all input sheets.
Review Data Monthly
Schedule a monthly data review session to keep the dashboard current and relevant.
Protect Key Sheets
Lock formula-based sheets like “Dashboard” and “Trend” to avoid accidental edits.
Use Color Coding Wisely
Maintain consistent color logic—green for good, red for below target—to make charts instantly readable.
Train Your Staff
Ensure everyone involved in data entry or decision-making understands how to use the tool.
Back Up Regularly
Always keep a copy of your Google Sheet in Google Drive or export it as Excel for security.
Conclusion
The Substance Abuse Center KPI Dashboard in Google Sheets transforms how rehabilitation centers track and analyze performance. It consolidates essential data, visualizes trends, and simplifies decision-making—all in one user-friendly platform.
By aligning operational activities with measurable KPIs, this tool helps treatment centers improve efficiency, accountability, and patient outcomes.
Whether you’re managing admissions, monitoring counselor workloads, or evaluating program success rates, this dashboard empowers you to make informed, data-driven decisions every single day.
Frequently Asked Questions (FAQ)
What is the purpose of a KPI Dashboard for a Substance Abuse Center?
It helps management monitor key metrics like relapse rate, treatment completion, counselor utilization, and patient satisfaction in real time.
Why use Google Sheets instead of software like Power BI or Tableau?
Google Sheets offers real-time collaboration, simplicity, and cost savings without the need for specialized training or licenses.
Can I add or remove KPIs from the dashboard?
Yes. The dashboard is fully customizable. You can modify KPI names, formulas, and chart ranges based on your specific needs.
Is this dashboard suitable for non-technical staff?
Absolutely. The interface is intuitive, and all key functions—like dropdowns and charts—require no advanced technical skills.
How often should I update the dashboard data?
Ideally, update it monthly or weekly depending on how frequently your center reviews its performance.
Can this dashboard be shared with multiple users?
Yes. Since it’s built in Google Sheets, you can easily share it with other users through Google Drive with view or edit permissions.
What are the most important KPIs for a Substance Abuse Center?
Some of the most critical include relapse rate, treatment completion rate, cost per patient, bed occupancy rate, counselor utilization, and patient satisfaction.
How can I visualize progress over time?
Use the Trend Sheet to view MTD and YTD comparisons through dynamic charts that show Actual vs Target and PY vs Actual patterns.
Is conditional formatting available in this dashboard?
Yes. Conditional formatting with arrows and colors highlights whether performance has improved or declined compared to targets and previous years.
Can I export the dashboard reports?
Yes. You can export charts and tables as PDF or Excel files directly from Google Sheets for sharing or presentations.
Visit our YouTube channel to learn step-by-step video tutorials
Youtube.com/@NeotechNavigators
Watch the step-by-step video tutorial:
Click to buy Substance Abuse Center KPI Dashboard in Google Sheets