Succession planning is no longer optional for modern organizations. When key leaders leave unexpectedly or critical roles remain vacant, businesses face serious operational and strategic risks. Because of this, HR teams and leadership need a clear, data-driven way to track succession readiness, talent pipeline strength, and leadership continuity. That is exactly where a Succession Planning KPI Dashboard in Google Sheets becomes extremely valuable.
This ready-to-use dashboard helps organizations track all critical succession planning KPIs in one place. It converts raw HR data into clear insights using MTD, YTD, targets, previous-year comparisons, and trend analysis. Moreover, because it is built in Google Sheets, it is easy to use, flexible, and accessible from anywhere.
In this article, we will explain how the dashboard works, what KPIs it tracks, how each worksheet supports decision-making, and how organizations can strengthen leadership continuity using this dashboard.
What Is a Succession Planning KPI Dashboard in Google Sheets?
A Succession Planning KPI Dashboard is a structured performance tracking tool designed to measure how well an organization prepares future leaders for key roles. Instead of relying on subjective opinions, this dashboard provides measurable indicators related to talent readiness, internal promotions, leadership risk, and development effectiveness.
Because this dashboard runs in Google Sheets, it allows:
-
Easy collaboration between HR and leadership
-
Fast updates without technical skills
-
Clear month-wise and year-wise comparisons
-
Custom KPIs based on business needs
As a result, succession planning becomes proactive instead of reactive.
Key Features of the Succession Planning KPI Dashboard
Click to Buy Succession Planning KPI Dashboard in Google Sheets
This dashboard is designed with 6 interconnected worksheets, each serving a specific purpose.
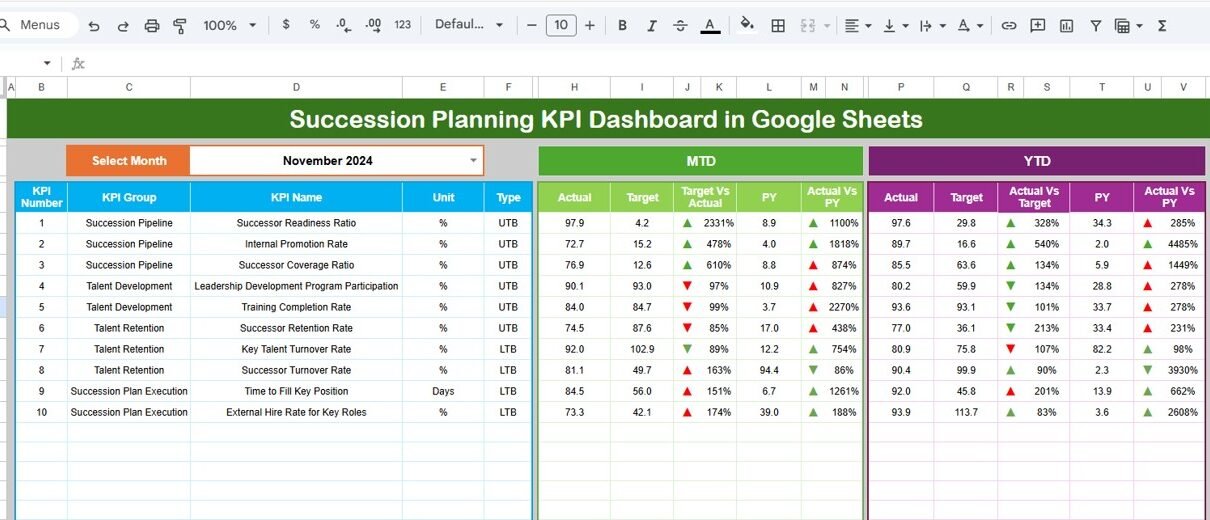
1. Dashboard Sheet Tab (Main Page)
This is the primary summary view.
On cell D3, you select the month from a dropdown. As soon as you change the month, the entire dashboard updates automatically.
The dashboard displays:
MTD (Month-to-Date):
-
Actual
-
Target
-
Previous Year
-
Target vs Actual
-
Previous Year vs Actual
YTD (Year-to-Date):
-
Actual
-
Target
-
Previous Year
-
Target vs Actual
-
Previous Year vs Actual
Conditional formatting with up/down arrows highlights performance clearly:
-
Green arrow → Positive movement
-
Red arrow → Negative movement
This page helps leadership review succession health in minutes.

Click to Buy Succession Planning KPI Dashboard in Google Sheets
2. KPI Trend Sheet Tab
This sheet allows deeper analysis of one KPI at a time.
You select the KPI name from the dropdown in cell C3, and the sheet displays:
-
KPI Group
-
KPI Unit
-
KPI Type (Lower the Better / Upper the Better)
-
KPI Formula
-
KPI Definition
Month-wise trend charts help identify long-term patterns and improvement areas.

Click to Buy Succession Planning KPI Dashboard in Google Sheets
3. Actual Number Sheet Tab
This sheet is used to enter actual MTD and YTD values.
-
Select the first month of the year in cell E1
-
Enter monthly actual performance values
-
All dashboard visuals update automatically
This ensures data consistency across the entire dashboard.

4. Target Sheet Tab
This sheet stores planned or desired KPI values:
-
Monthly targets (MTD)
-
Annual targets (YTD)
Targets allow leadership to measure readiness against expectations.

Click to Buy Succession Planning KPI Dashboard in Google Sheets
5. Previous Year Number Sheet Tab
This sheet holds last year’s KPI values.
It enables:
-
Year-on-year comparison
-
Leadership pipeline improvement tracking
-
Long-term succession maturity analysis

Click to Buy Succession Planning KPI Dashboard in Google Sheets
6. KPI Definition Sheet Tab
This is the reference foundation of the dashboard.
It includes:
-
KPI Name
-
KPI Group
-
Unit
-
Formula
-
KPI Definition
-
KPI Type (UTB / LTB)
This sheet ensures clarity and consistent KPI interpretation across teams.

Advantages of Using a Succession Planning KPI Dashboard
Click to Buy Succession Planning KPI Dashboard in Google Sheets
-
Clear visibility into leadership readiness
-
Reduced risk of leadership gaps
-
Data-driven promotion decisions
-
Improved internal mobility
-
Stronger leadership continuity
-
Better alignment between HR and business strategy
Opportunities for Improvement in Succession Planning
-
Integrate competency-based assessments
-
Add diversity and inclusion KPIs
-
Include succession risk heatmaps
-
Track leadership training ROI
-
Automate data collection from HR systems
Best Practices for Using the Dashboard
Click to Buy Succession Planning KPI Dashboard in Google Sheets
-
Review succession KPIs quarterly
-
Keep successor readiness data updated
-
Align KPIs with business strategy
-
Train managers on KPI interpretation
-
Compare current year vs previous year trends
Conclusion
A Succession Planning KPI Dashboard in Google Sheets transforms leadership planning from guesswork into a structured, measurable, and proactive process. With clear KPIs, automated comparisons, and trend analysis, organizations gain confidence in their leadership pipeline. Because the dashboard is flexible and easy to use, it supports better decisions today and long-term organizational stability tomorrow.
Frequently Asked Questions (FAQs)
Click to Buy Succession Planning KPI Dashboard in Google Sheets
Q1. Who should use this dashboard?
HR teams, leadership teams, talent managers, and executives.
Q2. Can KPIs be customized?
Yes, the KPI Definition sheet allows full customization.
Q3. Is this suitable for small organizations?
Yes, it works for both small and large organizations.
Q4. How often should data be updated?
Monthly updates work best for trend accuracy.
Q5. Does it require technical skills?
No, basic Google Sheets knowledge is enough.
Visit our YouTube channel to learn step-by-step video tutorials
Youtube.com/@NeotechNavigators
Watch the step-by-step video tutorial:
Click to Buy Succession Planning KPI Dashboard in Google Sheets