KPI Dashboard in Google Sheets In today’s fast-paced business world, optimizing logistics and supply chain performance is crucial. One of the best ways to achieve this is by tracking and analyzing key performance indicators (KPIs). A well-structured KPI dashboard can help managers and decision-makers monitor, track, and evaluate logistics and supply chain performance with precision.
If you’re looking for an efficient way to track your supply chain and logistics KPIs, using Google Sheets can be a game-changer. The flexibility of Google Sheets allows for easy integration, and its powerful features enable you to create a comprehensive Supply Chain – Logistics KPI Dashboard. This article will explore the essential KPIs, how to track them in Google Sheets, and provide best practices to make your dashboard a success.
Click to buy Supply Chain – Logistics KPI Dashboard in Google Sheets
Table of Contents
ToggleWhat is a Supply Chain – Logistics KPI Dashboard?
A Supply Chain – Logistics KPI Dashboard is a tool that helps organizations track and analyze their logistics and supply chain operations. It gives real-time insights into key performance areas, helping managers identify trends, monitor performance, and make data-driven decisions. The dashboard typically includes various KPIs, such as transportation costs, delivery performance, inventory turnover, and order fulfillment rates.
Using Google Sheets to create this dashboard is highly effective. It allows easy access, real-time collaboration, and the ability to share and edit the dashboard across teams. This article will provide you with a ready-to-use template for building your Supply Chain – Logistics KPI Dashboard in Google Sheets.
Key Features of the Supply Chain – Logistics KPI Dashboard in Google Sheets
This dashboard is designed to be user-friendly and comprehensive, consisting of six essential worksheets:
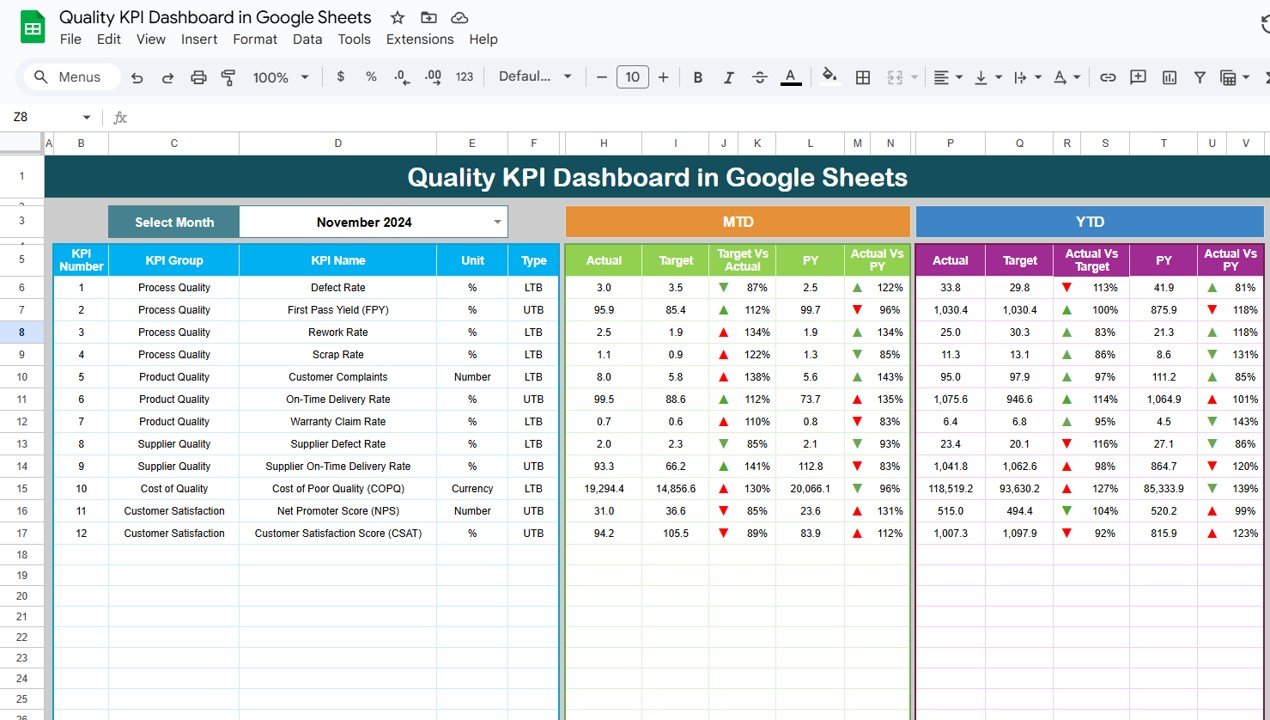
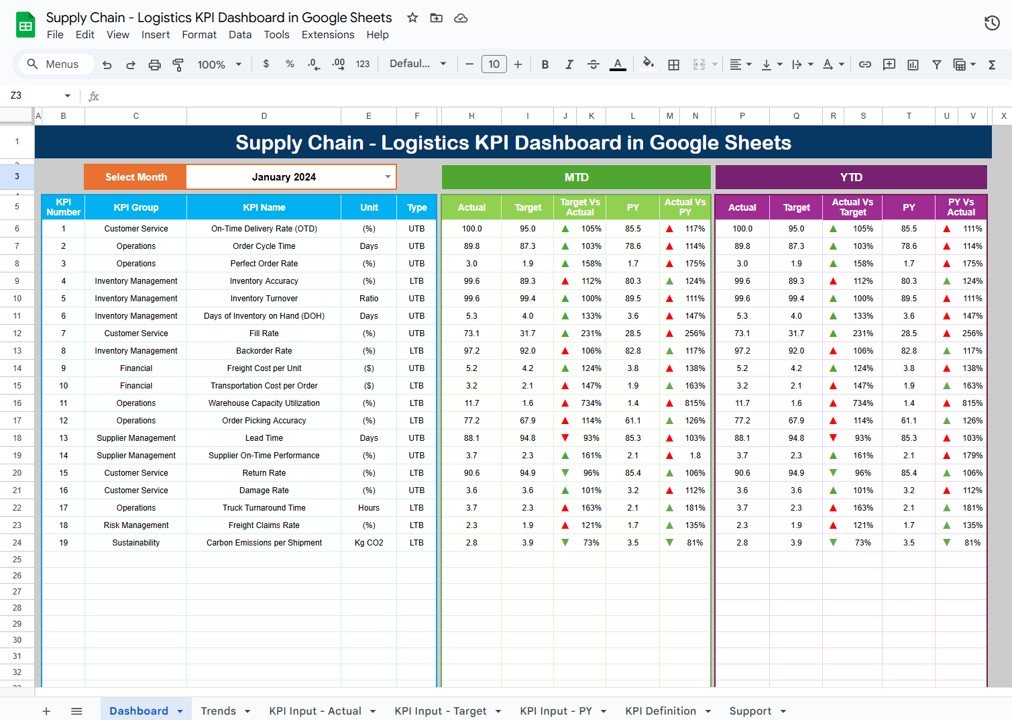
Dashboard Sheet Tab
This is the main sheet where all your KPI information is displayed.
Here, you can select the month from a dropdown menu (range D3), and all figures for the month will automatically update.
It includes MTD (Month-to-Date) Actual, Target, Previous Year Data, along with Target vs Actual and Previous Year vs Actual. The figures are visually represented with conditional formatting, featuring up and down arrows to indicate performance.
The dashboard also includes YTD (Year-to-Date) Actual, Target, and Previous Year Data with similar metrics and conditional formatting for easy comparison.

Click to buy Supply Chain – Logistics KPI Dashboard in Google Sheets
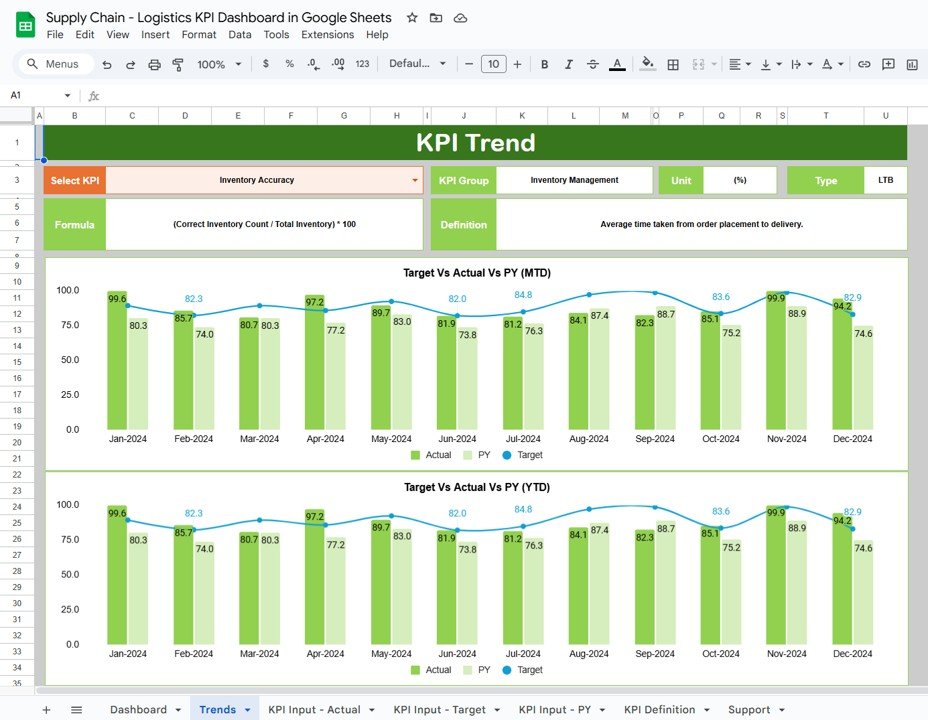
KPI Trend Sheet Tab
- In this tab, you can select a KPI from the dropdown list (range C3).
- The KPI group, unit of the KPI, and the type of KPI (whether “Lower the Better” or “Upper the Better”) are displayed here.
- You can also find the formula for calculating each KPI and its definition.
Click to buy Supply Chain – Logistics KPI Dashboard in Google Sheets
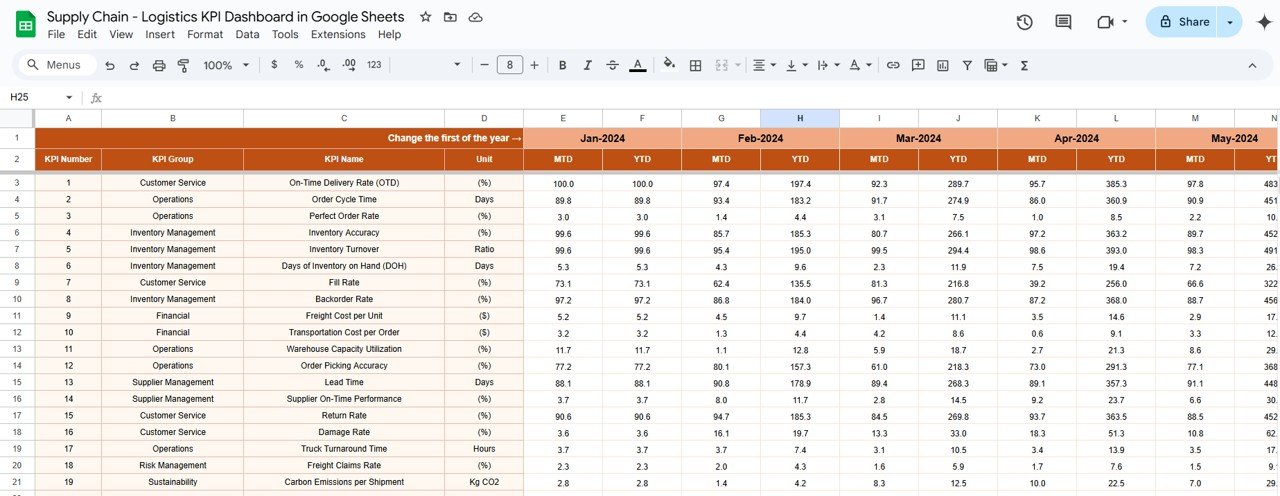
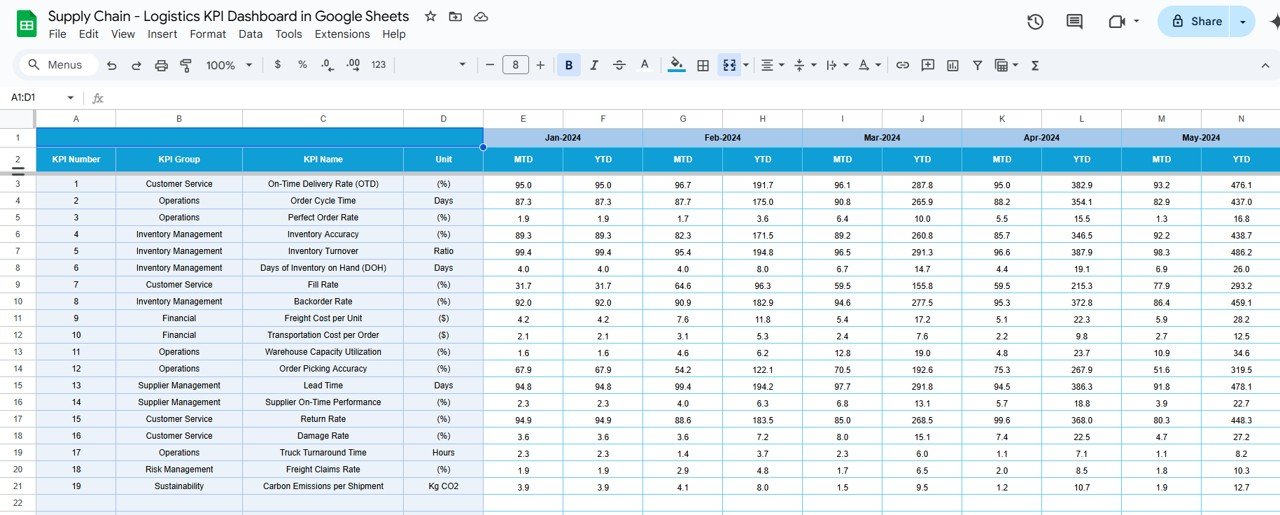
Actual Numbers Sheet Tab
In this tab, you input the actual numbers for both YTD and MTD for each month.
The month can be changed by updating the range (E1), and the dashboard will reflect the changes accordingly.
You can input values for the first month of the year, and the rest of the dashboard will update automatically.
Click to buy Supply Chain – Logistics KPI Dashboard in Google Sheets
Target Sheet Tab
This sheet is where you enter the target numbers for each KPI, both for MTD and YTD.
Targets are input on a monthly basis, allowing you to set specific goals for your logistics and supply chain operations.
Click to buy Supply Chain – Logistics KPI Dashboard in Google Sheets
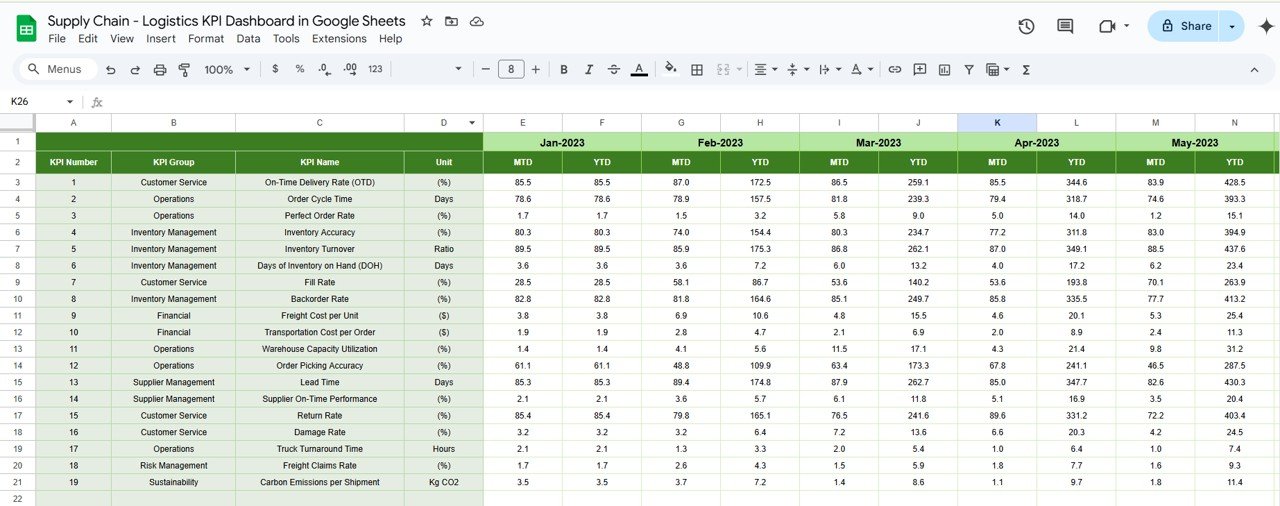
Previous Year Numbers Sheet Tab
Similar to the Actual Numbers sheet, you enter the previous year’s data here.
This allows for year-over-year comparisons and helps assess performance against historical trends.
Click to buy Supply Chain – Logistics KPI Dashboard in Google Sheets
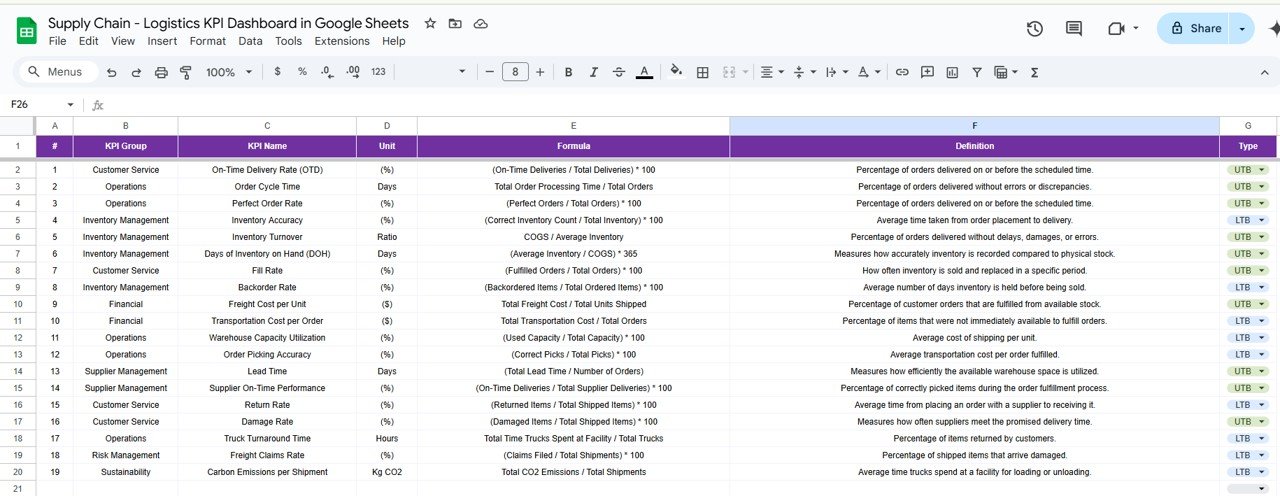
KPI Definition Sheet Tab
This is where you define the KPIs you are tracking.
For each KPI, you input its name, group, unit of measurement, calculation formula, and a detailed definition to ensure clarity and consistency in understanding.
Click to buy Supply Chain – Logistics KPI Dashboard in Google Sheets
Advantages of Using a Supply Chain – Logistics KPI Dashboard
Using a KPI dashboard for tracking your supply chain and logistics performance provides numerous advantages:
- Real-time Data Access: With a Google Sheets dashboard, you can access your data from anywhere and at any time, ensuring you have up-to-date information on your logistics performance.
- Enhanced Decision-Making: By tracking and visualizing key KPIs, you can make data-driven decisions to improve efficiency and reduce costs.
- Increased Efficiency: With automated updates and calculations, you save time and reduce manual errors, improving overall workflow.
- Better Performance Monitoring: The dashboard allows you to continuously monitor and compare your KPIs, helping you identify issues and opportunities for improvement.
- Scalability: As your business grows, you can easily scale your dashboard by adding more KPIs or adjusting the data inputs without losing performance.
Opportunities for Improvement in Supply Chain – Logistics
While a dashboard can significantly enhance your logistics operations, there are always opportunities for improvement. Here are a few:
- Data Accuracy: Ensure that all data entered into the dashboard is accurate and up-to-date. Inaccurate data will lead to misleading insights and poor decision-making.
- Automating Data Entry: You can explore automation tools to directly integrate your Google Sheets dashboard with other systems, such as your ERP or CRM, for seamless data flow.
- Enhanced Data Visualizations: Consider using more advanced visualizations such as heat maps, bubble charts, or gauges to provide deeper insights into your KPIs.
- Mobile Optimization: Ensure that the dashboard is mobile-friendly so that decision-makers can access it on-the-go.
Best Practices for the Supply Chain – Logistics Dashboard
Click to buy Supply Chain – Logistics KPI Dashboard in Google Sheets
To get the most out of your dashboard, follow these best practices:
- Define Clear KPIs: Be clear about what you want to measure and how each KPI aligns with your business goals.
- Use Conditional Formatting: Leverage conditional formatting in Google Sheets to make your data more intuitive, highlighting key trends or concerns.
- Regularly Update Data: Keep the data fresh by regularly updating both actual numbers and targets.
- Limit Complexity: Keep your dashboard simple and easy to use, avoiding unnecessary complexity that might overwhelm users.
- Collaborate with Your Team: Allow your team members to input their data and collaborate on the dashboard. This promotes ownership and encourages team-wide improvements.
Conclusion
A well-organized Supply Chain – Logistics KPI Dashboard in Google Sheets is an invaluable tool for tracking logistics performance, monitoring KPIs, and driving improvements across your supply chain. With the right KPIs in place, this dashboard enables you to make informed decisions, optimize operations, and improve overall efficiency.
By implementing the features and best practices discussed in this article, you can harness the full potential of a Supply Chain – Logistics KPI Dashboard and ensure your logistics operations are performing at their best.
Frequently Asked Questions (FAQs)
Q1: How do I create a KPI dashboard in Google Sheets?
A1: You can create a KPI dashboard in Google Sheets by organizing your data into multiple worksheets, such as actual numbers, targets, and previous year data, and using formulas and conditional formatting to calculate and visualize KPIs.
Q2: What KPIs should I track in a logistics dashboard?
A2: Key logistics KPIs include transportation costs, delivery performance, order fulfillment rate, inventory turnover, and order cycle time.
Q3: Can I automate the data input for my logistics KPI dashboard?
A3: Yes, you can automate data entry using tools like Google Apps Script or by integrating your dashboard with other business systems such as ERPs or CRMs.
Q4: How can I improve the accuracy of my logistics KPIs?
A4: Regularly update your data and verify that it is entered correctly. Use validation tools and collaborate with different teams to ensure data accuracy.
Q5: Can I share the Supply Chain KPI Dashboard with my team?
A5: Yes, Google Sheets allows easy sharing with your team for collaboration. You can also set permissions to control access levels.
Visit our YouTube channel to learn step-by-step video tutorials
Youtube.com/@NeotechNavigators