Sustainability has become a strategic priority for modern organizations. Companies now track environmental, social, and governance performance just as closely as financial results. However, when sustainability data stays scattered across reports, spreadsheets, and emails, decision-making becomes slow and unclear. Because of this challenge, a Sustainability Metrics KPI Dashboard in Google Sheets offers a simple, structured, and highly effective solution.Sustainability Metrics KPI Dashboard in Google Sheets
This ready-to-use dashboard helps organizations track sustainability KPIs such as energy usage, carbon emissions, waste management, water consumption, recycling rate, and social responsibility metrics. Moreover, it provides Month-to-Date (MTD) and Year-to-Date (YTD) performance tracking with clear comparisons against targets and previous year results.Sustainability Metrics KPI Dashboard in Google Sheets
In this article, we will explain how the Sustainability Metrics KPI Dashboard works, its worksheet structure, the complete KPI list with formulas, and how organizations can use it to strengthen sustainability performance.Sustainability Metrics KPI Dashboard in Google Sheets
What Is a Sustainability Metrics KPI Dashboard in Google Sheets?
A Sustainability Metrics KPI Dashboard is a centralized performance monitoring tool that tracks environmental and sustainability indicators in one structured Google Sheets file. It transforms raw sustainability data into meaningful insights using automated calculations, trend analysis, and performance indicators.
Because the dashboard runs in Google Sheets, it offers:
-
Easy collaboration
-
Real-time updates
-
No software cost
-
Simple customization
-
Cloud accessibility
This dashboard supports sustainability teams, ESG managers, operations teams, and leadership by providing complete visibility into sustainability performance.
Key Features of the Sustainability Metrics KPI Dashboard
Click to Buy Sustainability Metrics KPI Dashboard in Google Sheets
The dashboard includes 6 structured worksheet tabs, each designed for a specific purpose.
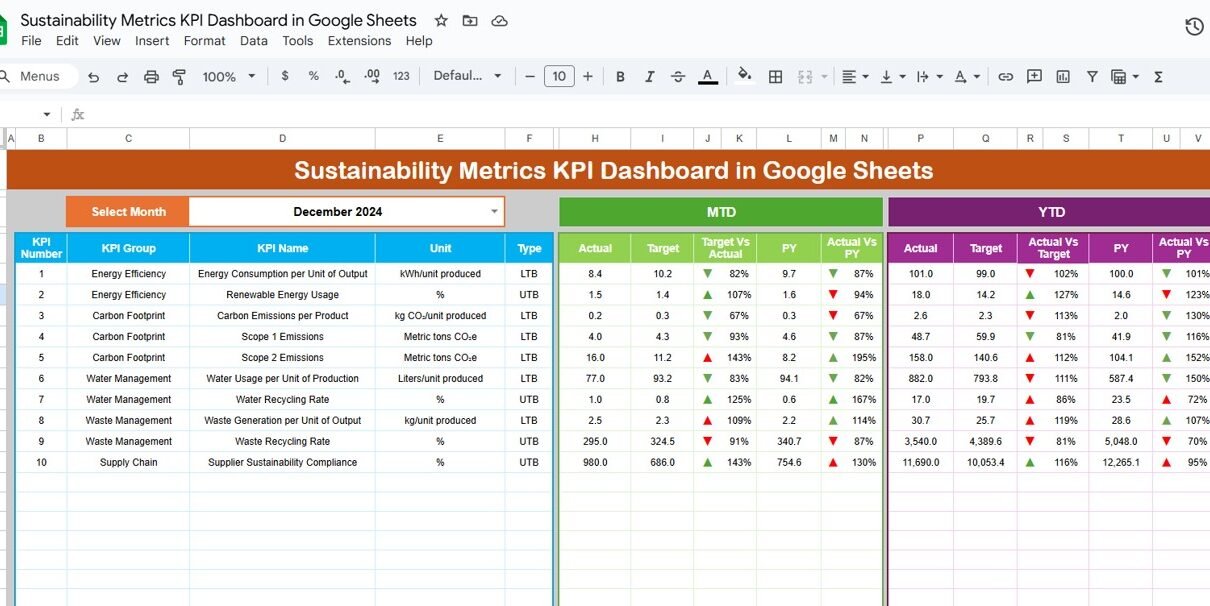
Dashboard Sheet Tab (Main Page)
This is the primary dashboard view. On cell D3, you select the reporting month from a dropdown. As soon as you change the month, the entire dashboard updates automatically.
The dashboard displays:
MTD Metrics
-
MTD Actual
-
MTD Target
-
MTD Previous Year
-
MTD Target vs Actual
-
MTD PY vs Actual
YTD Metrics
-
YTD Actual
-
YTD Target
-
YTD Previous Year
-
YTD Target vs Actual
-
YTD PY vs Actual
Conditional formatting with up and down arrows highlights performance clearly:
-
Green arrow → improvement
-
Red arrow → decline
This sheet becomes ideal for management reviews and sustainability reporting.

Click to Buy Sustainability Metrics KPI Dashboard in Google Sheets
KPI Trend Sheet Tab
In this sheet, you select a KPI name from the dropdown in cell C3. The dashboard then displays:
-
KPI Group
-
KPI Unit
-
KPI Type (Lower the Better or Upper the Better)
-
KPI Formula
-
KPI Definition
Trend charts show how each KPI changes month by month, helping teams identify patterns and improvement areas.

Click to Buy Sustainability Metrics KPI Dashboard in Google Sheets
Actual Number Sheet Tab
This sheet captures MTD and YTD actual values for each KPI.
-
You select the first month of the year in cell E1
-
Monthly and YTD calculations adjust automatically
-
Enter actual sustainability data here
All dashboard visuals update instantly.

Click to Buy Sustainability Metrics KPI Dashboard in Google Sheets
Target Sheet Tab
This sheet stores MTD and YTD targets for every KPI. Targets help teams:
-
Measure sustainability goals
-
Compare planned vs actual performance
-
Track progress toward ESG commitments

Click to Buy Sustainability Metrics KPI Dashboard in Google Sheets
Previous Year Number Sheet Tab
This sheet contains previous year KPI values. It enables:
-
Year-over-Year comparison
-
Long-term sustainability trend analysis
-
Performance benchmarking

Click to Buy Sustainability Metrics KPI Dashboard in Google Sheets
KPI Definition Sheet Tab
This sheet acts as the reference library for all KPIs. It includes:
-
KPI Name
-
KPI Group
-
Unit
-
Formula
-
Definition
-
KPI Type (LTB / UTB)
This ensures consistency and clarity across the organization.

Click to Buy Sustainability Metrics KPI Dashboard in Google Sheets
Advantages of the Sustainability Metrics KPI Dashboard
-
Clear sustainability visibility
-
Automated KPI calculations
-
Strong ESG reporting support
-
Faster decision-making
-
Improved compliance tracking
-
Easy collaboration across teams
-
No additional software cost
Opportunities for Improvement
Click to Buy Sustainability Metrics KPI Dashboard in Google Sheets
-
Integrate IoT or energy systems
-
Add department-wise sustainability KPIs
-
Introduce predictive sustainability analytics
-
Automate data imports
-
Add carbon reduction forecasting
Best Practices for Using the Dashboard
-
Update data monthly without delays
-
Set realistic sustainability targets
-
Review trends, not just current values
-
Align KPIs with ESG strategy
-
Train teams on KPI definitions
-
Protect data with access controls
Conclusion
Click to Buy Sustainability Metrics KPI Dashboard in Google Sheets
A Sustainability Metrics KPI Dashboard in Google Sheets helps organizations track, manage, and improve sustainability performance with clarity and confidence. It provides structured KPIs, automated comparisons, and trend analysis that support ESG goals and long-term environmental responsibility. Because the dashboard is simple, flexible, and cloud-based, it becomes a powerful tool for sustainability reporting and continuous improvement.
Frequently Asked Questions (FAQs)
1. Who should use this dashboard?
Sustainability teams, ESG managers, operations teams, and leadership.
2. Can I customize KPIs?
Yes, you can add or remove KPIs easily.
3. Does it support ESG reporting?
Yes, it aligns well with ESG and sustainability frameworks.
4. Is Google Sheets secure for sustainability data?
Yes, when access permissions are configured properly.
5. Can I track targets and previous year data?
Yes, the dashboard fully supports both.
6. Do I need technical skills to use it?
No, basic Google Sheets knowledge is enough.
Visit our YouTube channel to learn step-by-step video tutorials
Youtube.com/@NeotechNavigators
Watch the step-by-step video tutorial:
Click to Buy Sustainability Metrics KPI Dashboard in Google Sheets