Sustainable tourism plays a vital role in promoting environmentally and socially responsible travel. As the tourism industry increasingly focuses on sustainability, it is important for organizations to track and measure their sustainability efforts. The Sustainable Tourism KPI Dashboard in Google Sheets is a comprehensive tool designed to help tourism businesses monitor key performance indicators (KPIs) related to their sustainability initiatives. This dashboard allows businesses to track their environmental impact, community engagement, and overall sustainability performance. In this article, we’ll explore the key features of this dashboard, the KPIs it tracks, and how it supports sustainable tourism practices.
What is the Sustainable Tourism KPI Dashboard in Google Sheets?
The Sustainable Tourism KPI Dashboard in Google Sheets is a tool that helps organizations in the tourism industry track and manage sustainability metrics. It provides insights into various KPIs related to sustainable tourism, such as carbon footprint reduction, waste management, local community engagement, and sustainable sourcing practices. By using this dashboard, tourism organizations can assess their sustainability performance, identify areas for improvement, and make informed decisions to reduce their environmental impact.
The dashboard consists of several worksheets, each offering different views and metrics for tracking sustainability efforts.
Key Features of the Sustainable Tourism KPI Dashboard
The Sustainable Tourism KPI Dashboard contains the following six worksheets to provide detailed insights into various aspects of sustainable tourism:
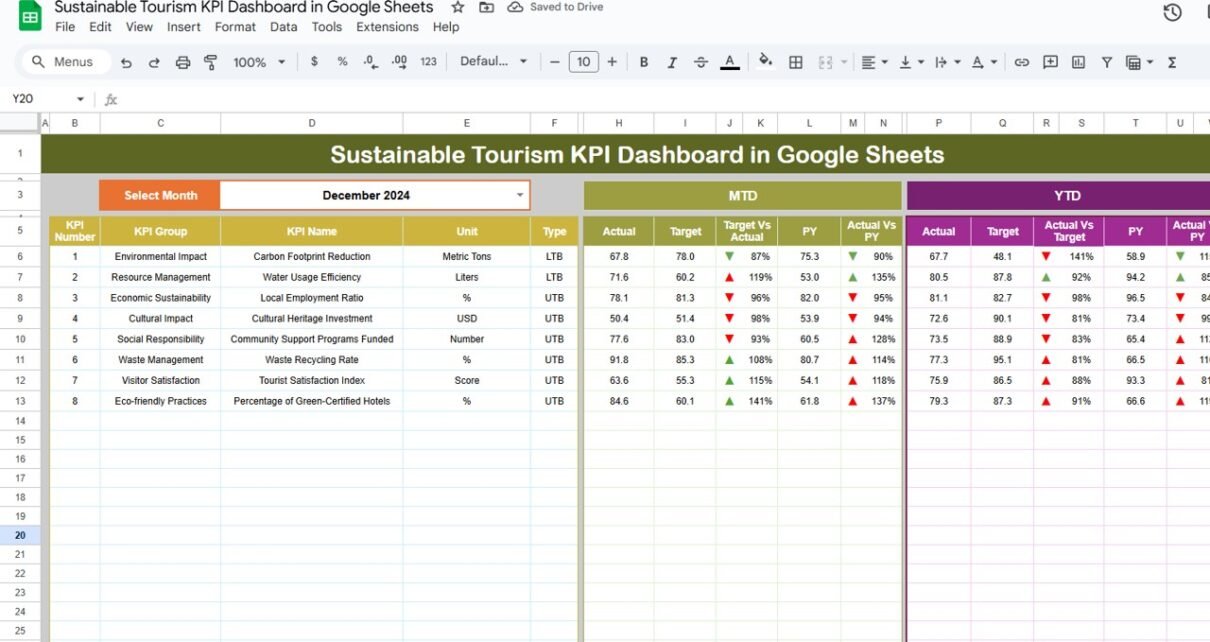
1. Dashboard Sheet Tab
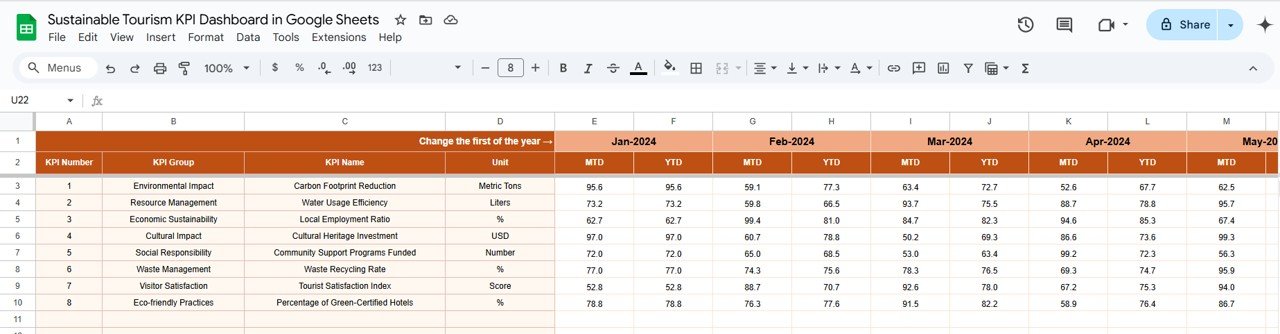
The Dashboard Sheet is the main page of the dashboard, providing a high-level view of all the KPIs. It includes:
-
MTD (Month-to-Date) Actuals: Displays actual data for the current month.
-
YTD (Year-to-Date) Actuals: Displays cumulative data for the year so far.
-
Target vs. Actual Comparison: Compares actual performance against the set targets for both MTD and YTD, with conditional formatting for visual comparison (up/down arrows).
-
Previous Year (PY) Comparison: Compares current-year data with the previous year’s data.
-
Month Selection: A dropdown (Range D3) allows users to select a specific month, and the entire dashboard updates accordingly.

Click to buy Sustainable Tourism KPI Dashboard in Google Sheets
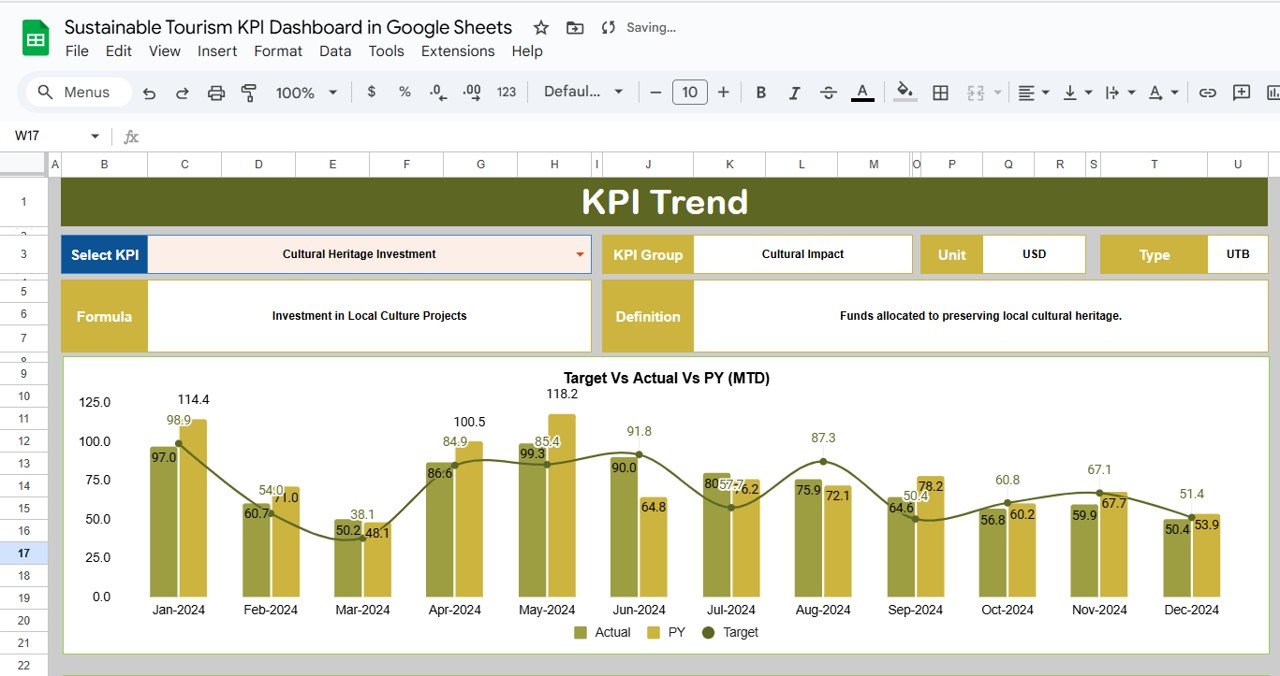
2. KPI Trend Sheet Tab
This sheet allows you to select specific KPIs from a dropdown (Range C3) and provides detailed information about each KPI, including:
-
KPI Group: The category the KPI belongs to (e.g., Environmental Impact, Social Responsibility).
-
Unit of KPI: The unit of measurement for the KPI (e.g., percentage, tons, dollars).
-
KPI Type: Indicates whether the KPI is “Lower the Better” (LTB) or “Upper the Better” (UTB).
-
Formula: The formula used to calculate the KPI.
-
Definition: A brief explanation of what the KPI measures.
Click to buy Sustainable Tourism KPI Dashboard in Google Sheets
3. Actual Numbergs Sheet Tab
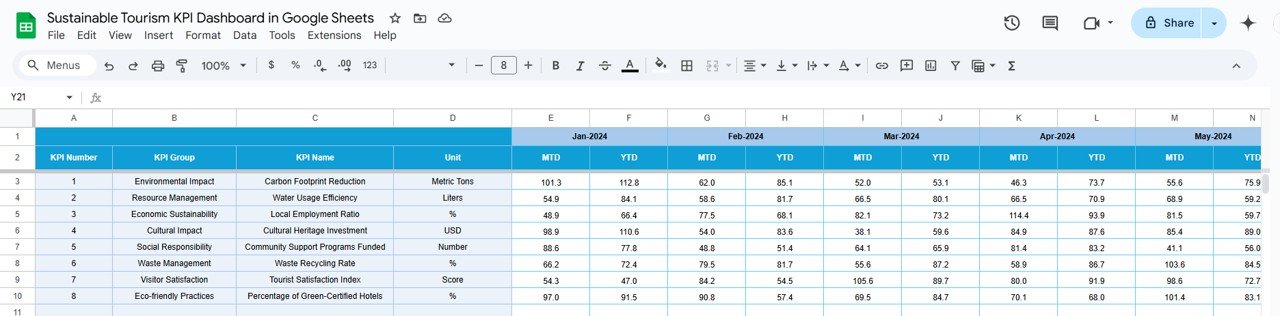
The Actual Numbers Sheet is where you input the actual values for MTD and YTD. The dashboard will automatically update once the data is entered for the selected month (
4. Target Sheet Tab
In the Target Sheet, you enter the target values for each KPI, both for MTD and YTD, so that you can compare actual performance against these targets.
Click to buy Sustainable Tourism KPI Dashboard in Google Sheets
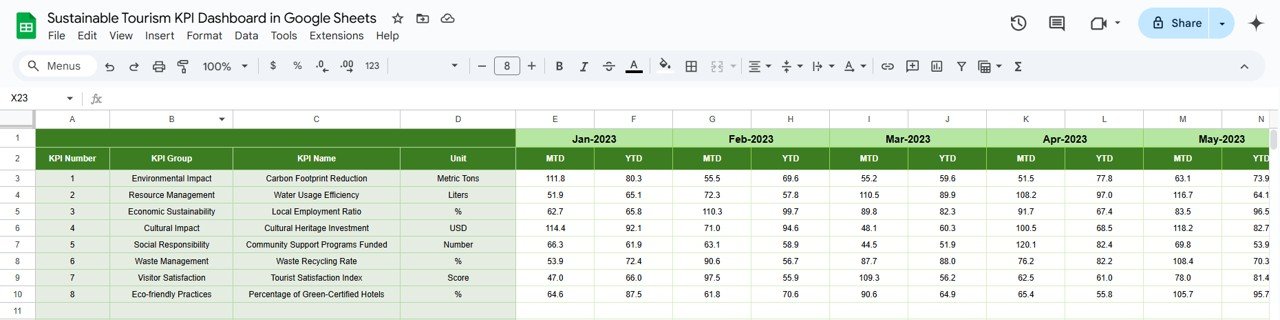
5. Previous Year Numbers Sheet Tab
This sheet captures data from the previous year, allowing you to compare performance year-over-year. By entering the previous year’s values, you can assess long-term trends and improvements in sustainability.
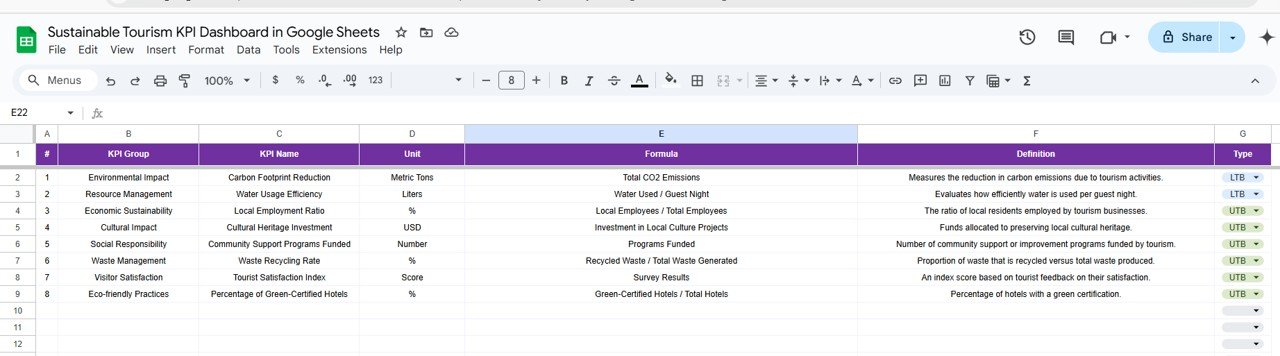
6. KPI Definition Sheet Tab
This sheet serves as a reference for understanding the KPIs. It includes:
-
KPI Name
-
KPI Group
-
Unit of Measurement
-
Formula
-
KPI Definition
This ensures that all stakeholders are clear on the goals and metrics being tracked.
Click to buy Sustainable Tourism KPI Dashboard in Google Sheets
Advantages of Using the Sustainable Tourism KPI Dashboard
-
Comprehensive Tracking: Track a wide range of sustainability metrics related to environmental, social, and economic impacts.
-
Data-Driven Decisions: The dashboard helps tourism organizations make informed decisions to improve sustainability and reduce environmental impact.
-
Customizable: Easily modify the KPIs, formulas, and data fields to fit your specific sustainability goals.
-
Year-over-Year Comparison: Compare current-year data against previous year data to evaluate long-term sustainability efforts.
-
Real-Time Monitoring: The dashboard updates automatically, providing real-time insights into your sustainability performance.
Best Practices for Using the Sustainable Tourism KPI Dashboard
Click to buy Sustainable Tourism KPI Dashboard in Google Sheets
To get the most out of the Sustainable Tourism KPI Dashboard, follow these best practices:
-
Regularly Update Data: Ensure that data for MTD and YTD is updated regularly for accurate performance tracking.
-
Set Realistic Targets: Use historical data to set achievable sustainability targets that align with your organization’s goals.
-
Focus on Key KPIs: Regularly monitor critical KPIs such as Carbon Footprint and Waste Diversion Rate to track environmental impact.
-
Compare Performance Year-over-Year: Use the Previous Year Numbers Sheet to track progress and identify areas for improvement.
-
Review KPIs Regularly: Regularly review and adjust KPIs to ensure they remain aligned with your evolving sustainability goals.
Conclusion
The Sustainable Tourism KPI Dashboard in Google Sheets is a powerful tool for tracking and optimizing sustainability efforts in the tourism industry. By monitoring key metrics such as Carbon Footprint, Waste Diversion Rate, and Water Usage Efficiency, this dashboard enables businesses to make data-driven decisions that contribute to more sustainable tourism practices. Whether you’re a small hotel or a large tourism operator, this dashboard can help you achieve your sustainability goals and improve your overall environmental performance.
Frequently Asked Questions (FAQs)
Click to buy Sustainable Tourism KPI Dashboard in Google Sheets
1. What KPIs are most important for tracking in the Sustainable Tourism KPI Dashboard?
Key KPIs for sustainable tourism businesses include Carbon Footprint, Waste Diversion Rate, Water Usage Efficiency, Local Community Engagement, and Sustainable Product Sourcing.
2. How can I update the dashboard with new data?
You can update the dashboard by entering actual values for MTD and YTD in the Actual Numbers Sheet, and inputting target data in the Target Sheet.
3. Can I customize the dashboard to track additional metrics?
Yes, the dashboard is fully customizable. You can add new KPIs or adjust existing ones based on your business’s sustainability goals.
4. How often should the dashboard be updated?
It’s recommended to update the dashboard regularly, either monthly or quarterly, to keep track of sustainability progress.
5. How do I compare current performance with the previous year?
You can compare current performance with previous year data by using the Previous Year Numbers Sheet to track year-over-year performance.
Visit our YouTube channel to learn step-by-step video tutorials
Youtube.com/@NeotechNavigators
Watch the step-by-step video Demo:
Click to buy Sustainable Tourism KPI Dashboard in Google Sheets