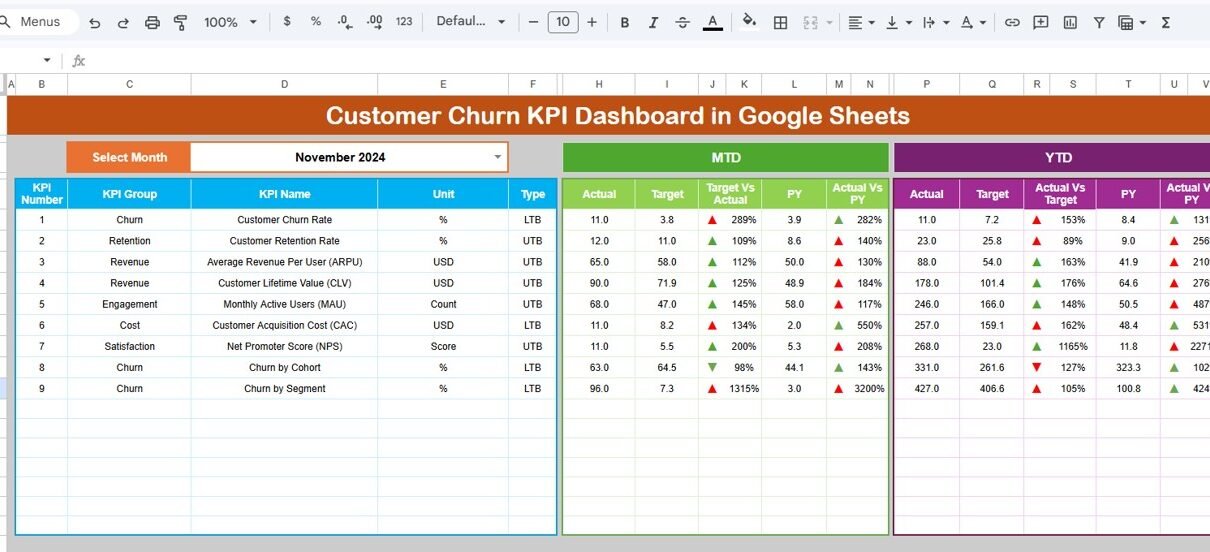
Google Sheets

Employee Wellness KPI Dashboard in Google Sheets

Employee wellness is a critical aspect of any organization, influencing productivity, job satisfaction, and overall company culture. Tracking employee wellness metrics helps businesses monitor the well-being of their workforce and make data-driven decisions to improve health and engagement. One of the most efficient ways to track employee wellness is through a KPI Dashboard in Google […]

Google Sheets

Customer Engagement KPI Dashboard in Google Sheets

In today’s fast-paced business environment, tracking customer engagement is crucial for any organization aiming to improve its customer relationships and drive growth. One of the most effective ways to monitor customer engagement is through a Customer Engagement KPI Dashboard. This powerful tool allows businesses to visualize key performance indicators (KPIs) in an easily digestible format, […]

Google Sheets

Operations KPI Dashboard in Google Sheets

In today’s data-driven world, businesses must constantly monitor and optimize their operations to remain competitive. One of the most effective ways to track performance and drive improvements is by using an Operations KPI (Key Performance Indicator) Dashboard. This powerful tool allows organizations to keep track of key metrics, assess their progress toward goals, and make […]

Google Sheets

Track Real-Time Sales Performance in Google Sheets

Track Real-Time Sales Performance in Google Sheets in real time is crucial for any business. By having up-to-date information, companies can make informed decisions that improve profitability and efficiency. With Google Sheets, you can easily track sales, analyze trends, and visualize performance metrics. In this comprehensive tutorial, we’ll guide you through the process of setting […]

Google Sheets

How to Create Dynamic Dashboards in Google Sheets

In today’s fast-paced data-driven world, businesses need efficient tools to analyze and visualize information quickly. Google Sheets is one such tool that offers both flexibility and functionality when it comes to data management and visualization. One of its powerful features is the ability to create dynamic dashboards, which help decision-makers track performance, trends, and other […]

Google Sheets

Conditional formatting in Google Sheet Chart

In the bustling world of business analytics, visual data representation isn’t just about showing numbers; it’s about telling a story. Google Sheets offers a powerful tool—Conditional formatting in Google Sheet Chart—that helps you narrate this story more effectively. Whether it’s a sales dashboard or a daily report, understanding how to apply conditional formatting can transform […]