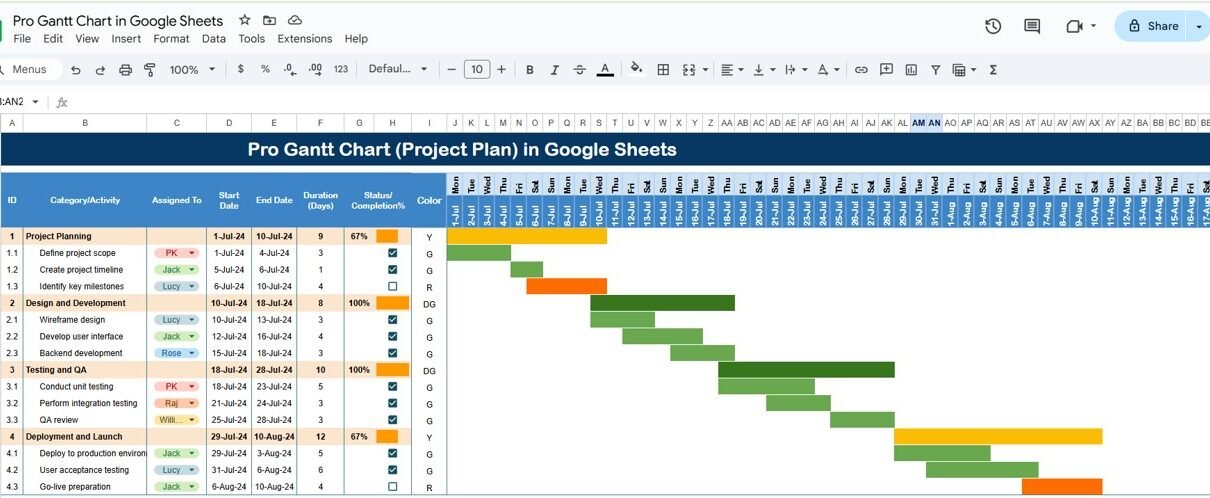
A Pro Gantt Chart is one of the most effective tools for visualizing project timelines and ensuring that all activities are tracked efficiently. Whether you are managing a small team or handling a large-scale project, a Gantt chart allows you to break down the tasks and track their progress over time. In this article, we’ll […]
Tag: color-coding
Conditional Formatting in Google Sheets Chart
Google Sheets offers a wide range of features to help you visualize and analyze data efficiently. One of the most powerful and visually appealing options is Conditional Formatting in Google Sheets Charts. By using conditional formatting, you can instantly highlight key data points, making it easier to interpret your data. In this article, we will […]