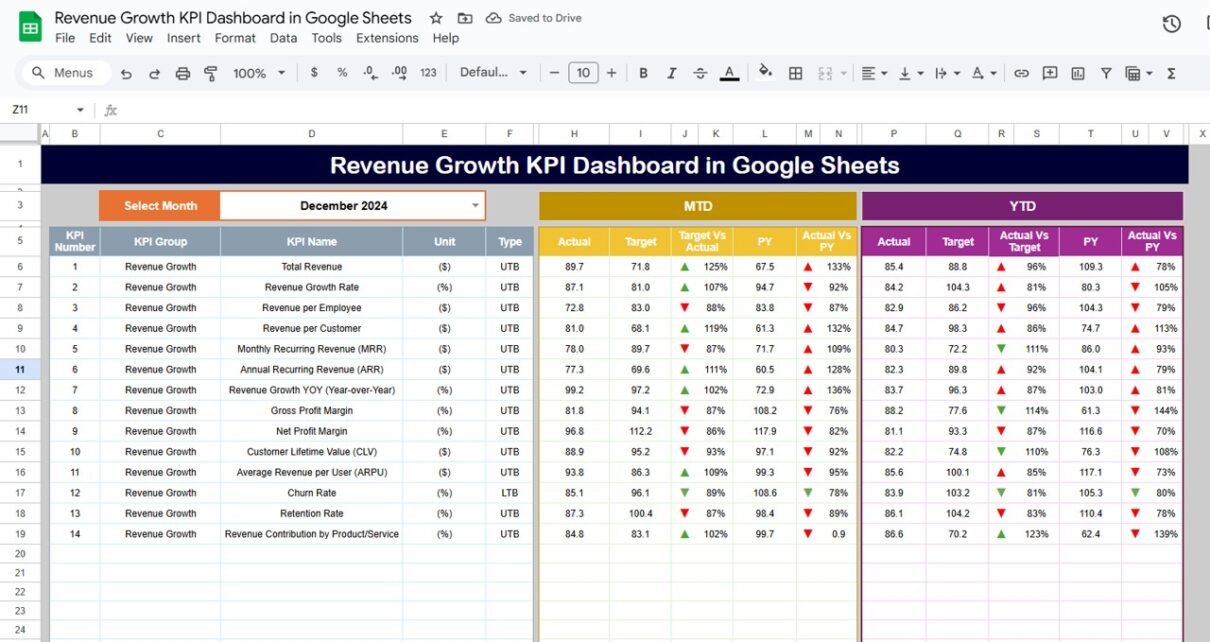
Google Sheets

Sports KPI Dashboard in Google Sheets

In the world of sports, performance is everything. Whether you are managing a professional team, organizing a fitness program, or overseeing a sports-related business, tracking Key Performance Indicators (KPIs) is crucial to ensuring continuous improvement. A Sports KPI Dashboard in Google Sheets is a versatile and effective tool for managing and monitoring the performance of […]

Google Sheets

Publishing KPI Dashboard in Google Sheets

In today’s digital world, tracking Key Performance Indicators (KPIs) is crucial for any business, including the publishing industry. By utilizing a Publishing KPI Dashboard in Google Sheets, organizations can seamlessly track their progress, assess their strategies, and make data-driven decisions. This guide will walk you through the key features, advantages, opportunities for improvement, best practices, […]

Google Sheets

Legal KPI Dashboard in Google Sheets

In the fast-paced legal environment, staying on top of key performance indicators (KPIs) is essential for tracking progress, improving efficiency, and ensuring smooth operations. A Legal KPI Dashboard in Google Sheets provides law firms and legal departments with an intuitive, easily accessible way to track critical data points related to their legal operations. This article […]

Google Sheets

Pharmaceutical KPI Dashboard in Google Sheets

In today’s competitive pharmaceutical industry, tracking key performance indicators (KPIs) is essential for monitoring the performance of various processes, improving decision-making, and ensuring efficiency. Whether it’s managing inventory, production cycles, or sales performance, a well-structured KPI dashboard in Google Sheets provides a practical, cost-effective solution for businesses of all sizes. In this article, we’ll dive […]

Google Sheets

Media & Entertainment KPI Dashboard in Google Sheets

The media and entertainment industry thrives on creativity, innovation, and performance. However, to truly succeed in a competitive environment, it’s essential for organizations to track and measure their performance against key metrics. A Media & Entertainment KPI Dashboard in Google Sheets is an excellent tool for managing and visualizing key performance indicators (KPIs) in this […]

Google Sheets

Public Sector KPI Dashboard in Google Sheets

In today’s fast-paced world, data-driven decision-making is crucial, especially in the public sector. Public Sector organizations face unique challenges such as transparency, accountability, and efficiency. One powerful tool that can help address these challenges is a Key Performance Indicator (KPI) dashboard. A Public Sector KPI Dashboard in Google Sheets allows government agencies and public sector […]

Power BI

Field Parameters in Power BI with 3 easy examples

In the world of data visualization, Microsoft Power BI has revolutionized the way users interact with their data. One powerful is Field Parameters in Power BI, which allow users to create dynamic reports and dashboards by switching between different fields in their visuals. Whether you’re a beginner or an experienced Power BI user, mastering Field […]

Google Sheets

Dynamic Map in Google Sheets

Google Sheets is a powerful tool for managing data and creating visualizations. One of its advanced features is the ability to create dynamic maps. A dynamic map in Google Sheets allows you to visualize data in an interactive, map-based format that updates based on user input. This can be incredibly useful for tracking sales performance, […]