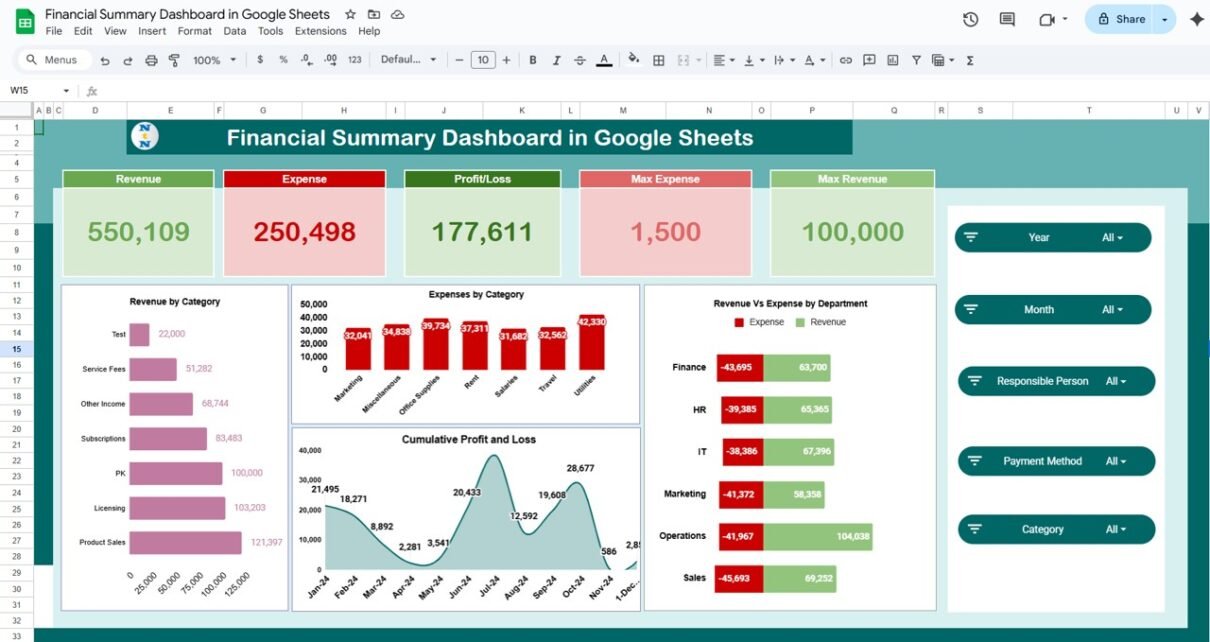
Revenue drives every business decision. However, many organizations struggle to understand where revenue comes from, which products perform best, and why targets sometimes fail. Because data often stays scattered across spreadsheets and systems, leaders lose visibility and control. That is exactly why a Revenue Analysis Dashboard in Google Sheets becomes an essential solution. This ready-to-use […]
Tag: Financial Analytics
Finance KPI Scorecard in Google Sheets
Monitoring financial performance is essential for business growth and sustainability. The Finance KPI Scorecard in Google Sheets is a ready-to-use template that helps finance teams track key financial metrics, analyze trends, and make data-driven decisions. In this article, we will explain the features, advantages, and best practices of using this finance KPI scorecard. What Is […]
Financial Summary Dashboard in Google Sheets
Effective financial management is critical for any organization. The Financial Summary Dashboard in Google Sheets provides a ready-to-use solution for tracking revenue, expenses, and profit in one centralized tool. With interactive charts and cards, this dashboard allows finance teams, managers, and executives to analyze financial performance and make data-driven decisions efficiently. In this article, we […]


