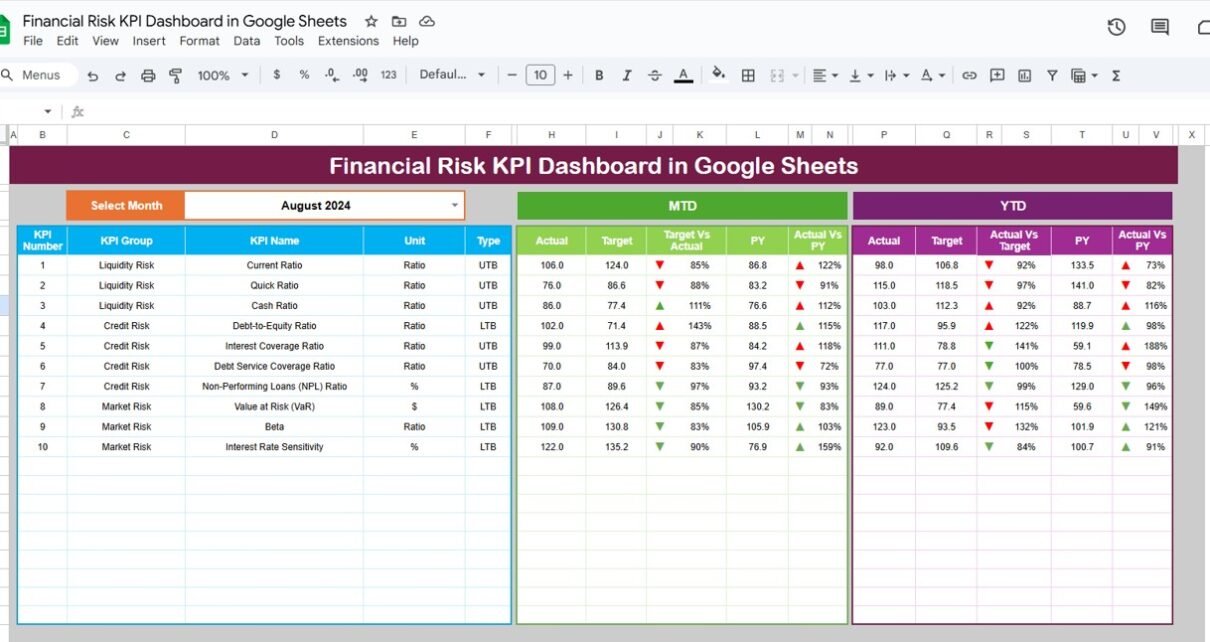
Financial risk increases when organizations do not track their exposure, credit performance, liquidity, operational issues, or market fluctuations in a structured way. Because business data keeps growing every day, manual risk reporting often becomes slow, unclear, and inconsistent. This leads to delayed decisions, higher losses, and weak risk visibility.Financial Risk KPI Dashboard in Google Sheets […]
Tag: financial KPIs
Budget Adherence KPI Dashboard in Google Sheets
Every business wants to control its spending, reduce financial surprises, and stay aligned with planned budgets. However, most companies still track monthly spending manually in spreadsheets, emails, or scattered documents. Because of this, financial teams lose clarity, overspend unintentionally, and fail to monitor budget deviations on time. A Budget Adherence KPI Dashboard in Google Sheets […]
Financial Summary Dashboard in Google Sheets
Effective financial management is critical for any organization. The Financial Summary Dashboard in Google Sheets provides a ready-to-use solution for tracking revenue, expenses, and profit in one centralized tool. With interactive charts and cards, this dashboard allows finance teams, managers, and executives to analyze financial performance and make data-driven decisions efficiently. In this article, we […]
Investment Management KPI Dashboard in Google Sheets
In the investment management industry, it is essential to keep track of key performance indicators (KPIs) to evaluate investment performance, risk, and portfolio growth. A well-structured KPI dashboard helps investors and fund managers monitor their key metrics, make informed decisions, and maximize returns. In this article, we will explore the Investment Management KPI Dashboard in […]


