Dashboard

Office IT Helpdesk Dashboard in Google Sheets

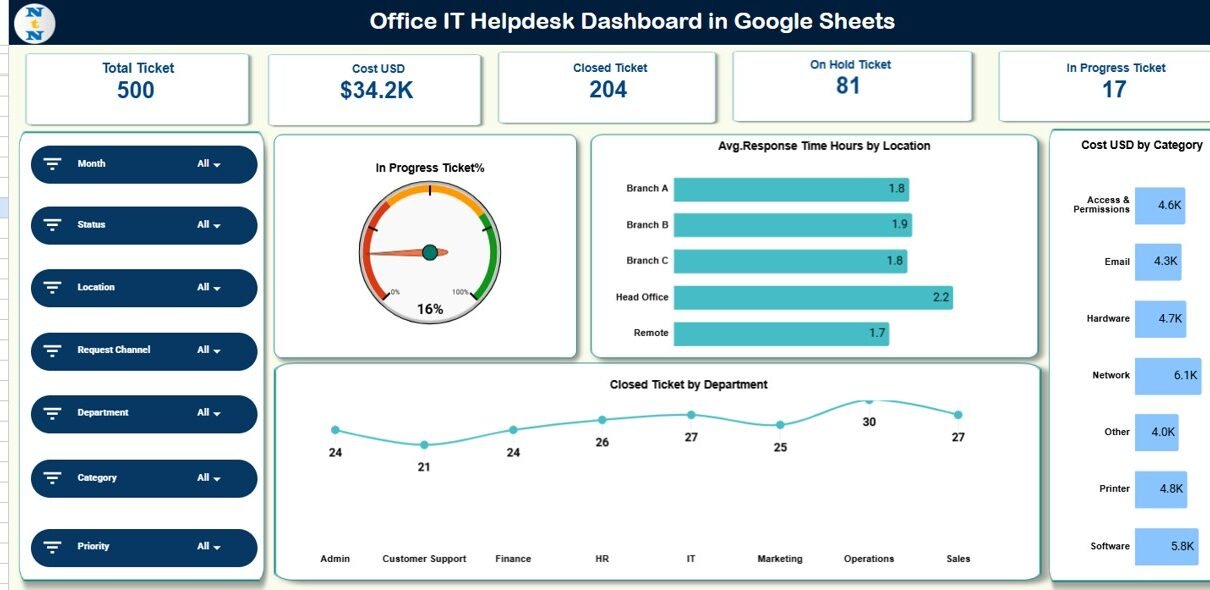
Every organization depends on IT support to keep daily operations running smoothly. Employees raise tickets for system issues, software access, hardware problems, network outages, and application errors. However, when IT teams track these requests in emails or scattered spreadsheets, visibility drops and response time increases. As a result, productivity suffers and user satisfaction declines.Office IT […]

KPI Dashboard

Tech Support Efficiency KPI Dashboard in Google Sheets

Tech support teams directly impact customer satisfaction, system uptime, and business productivity. Every delayed response, unresolved ticket, or missed SLA affects both users and business operations. However, many organizations still track tech support performance using basic spreadsheets or scattered tools. As a result, teams lose visibility, efficiency drops, and service quality suffers.Tech Support Efficiency KPI […]

KPI Dashboard

IT Operations KPI Dashboard in Google Sheets

IT operations teams maintain the stability, performance, and availability of business systems. However, when systems grow complex, teams struggle to track incidents, downtime, service quality, costs, and workloads. Because of limited visibility, issues escalate faster, response slows down, and service quality suffers. That is why organizations now rely on structured KPI dashboards. An IT Operations […]