In the world of business, managing risks is crucial for maintaining stability and ensuring long-term success. A Risk Management KPI Dashboard in Google Sheets serves as an essential tool that allows organizations to monitor, evaluate, and manage various risks in real-time. It helps businesses stay on top of their risk management strategies, making it easier […]
Tag: Real-Time Data
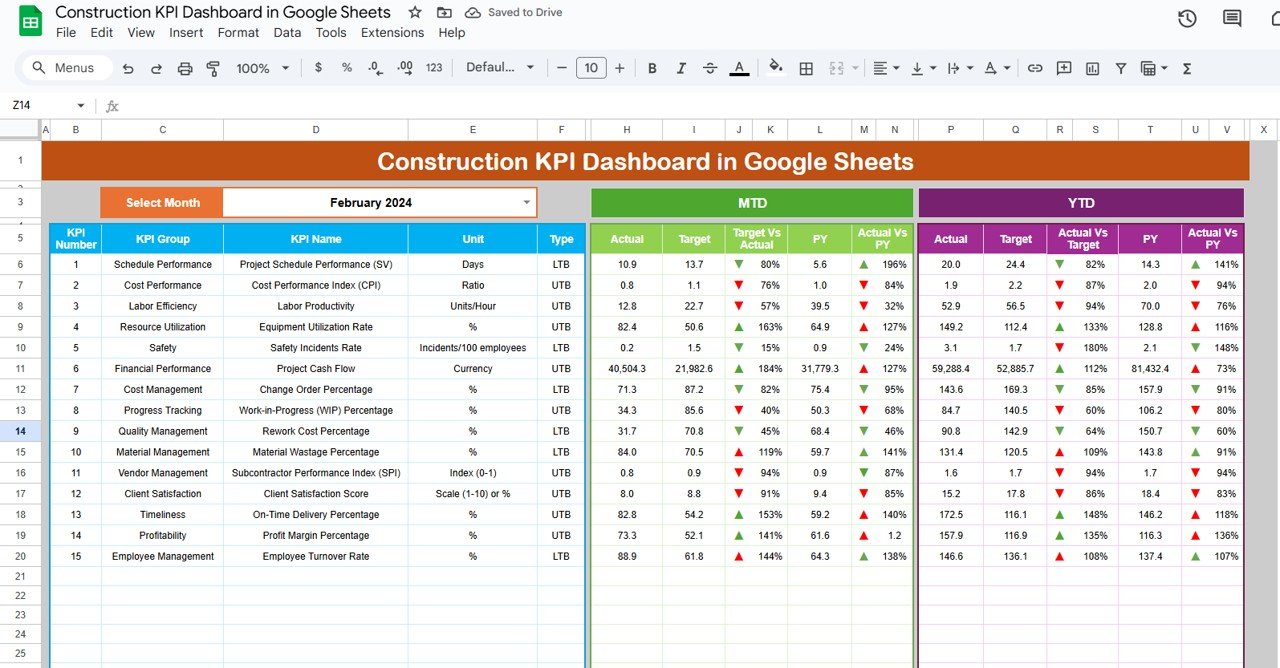
Construction KPI Dashboard in Google Sheets
In the construction industry, tracking and managing performance metrics is crucial to ensuring successful project completion. A Construction KPI Dashboard in Google Sheets can streamline the process, providing a centralized, real-time view of key metrics. By using such a dashboard, project managers can monitor project performance, optimize resources, and ensure that deadlines and budget constraints […]
General Management KPI Dashboard in Google Sheets
In today’s dynamic business environment, general management professionals need to closely track various performance indicators to ensure that their organizations are on the right path toward success. Key performance indicators (KPIs) are essential for measuring progress toward organizational goals, and a well-designed KPI dashboard can simplify this process. In this article, we will explore how […]
How to Create Dynamic Dashboards in Google Sheets
In today’s fast-paced data-driven world, businesses need efficient tools to analyze and visualize information quickly. Google Sheets is one such tool that offers both flexibility and functionality when it comes to data management and visualization. One of its powerful features is the ability to create dynamic dashboards, which help decision-makers track performance, trends, and other […]
Connecting Power BI with Excel
Power BI and Excel are two of the most popular tools for data analysis and visualization. While each has its strengths, combining them can unlock even more powerful insights. Connecting Power BI with Excel allows you to work with Excel data in Power BI and vice versa, making your data analysis workflow more efficient. In […]


