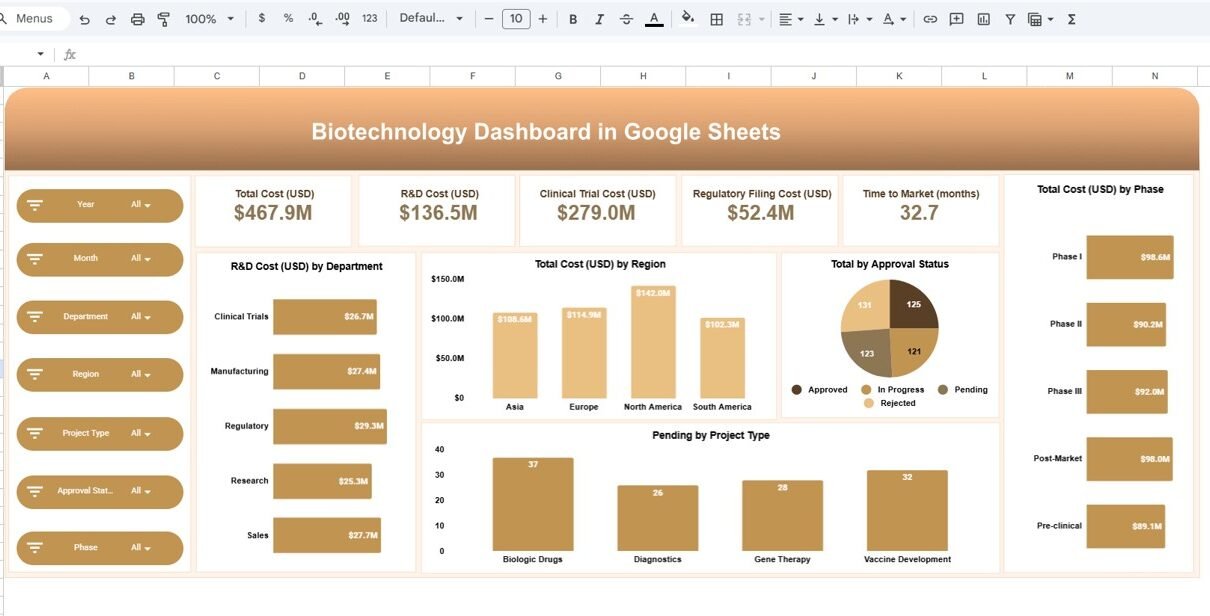
The biotechnology industry operates in a highly data-intensive environment where research investments, clinical trials, regulatory approvals, and operational costs must remain carefully monitored. Organizations continuously analyze multiple projects across departments, regions, and development phases. However, many biotech companies still depend on static spreadsheets and manual reports, which makes performance tracking slow and inefficient. Therefore, businesses […]
Tag: Research Performance Dashboard
Biotechnology KPI Scorecard In Google Sheets
The biotechnology industry operates in a highly data-driven environment. Organizations must track research progress, operational efficiency, regulatory compliance, and financial performance simultaneously. However, many biotech teams still manage performance tracking using disconnected spreadsheets and manual reports. As a result, they lose visibility, delay decisions, and struggle to measure real progress. Therefore, companies now adopt structured […]
Tissue Engineering KPI Dashboard in Google Sheets
Tissue engineering is a highly specialized and data-intensive field where success depends on precise monitoring of research efficiency, quality outcomes, cost control, and long-term performance trends. Managing these KPIs manually across multiple spreadsheets can quickly become time-consuming and error-prone.Tissue Engineering KPI Dashboard in Google Sheets That is where the Tissue Engineering KPI Dashboard in Google […]
Gene Therapy KPI Dashboard in Google Sheets
Gene therapy programs operate in a highly complex, data-driven, and compliance-sensitive environment. Tracking performance manually across experiments, trials, manufacturing, and quality metrics often leads to delays, errors, and missed insights. That is exactly why the Gene Therapy KPI Dashboard in Google Sheets is a powerful, ready-to-use solution for research teams, biotech companies, and life-science organizations. […]


