Managing team productivity and workload becomes challenging when tasks increase, priorities shift, and multiple team members handle different responsibilities. The Team Productivity & Workload Dashboard in Google Sheets provides a complete and ready-to-use solution for tracking productivity levels, workload distribution, and task progress — all in one place.
Team Productivity & Workload Dashboard in Google SheetsTeam Productivity & Workload Dashboard in Google Sheets
This dashboard helps team leaders, managers, and project coordinators monitor task status, analyze performance, and understand where team members are overloaded or underutilized. With automated charts and a clean layout, this dashboard delivers clear visibility into day-to-day team performance.Team Productivity & Workload Dashboard in Google Sheets
What Is a Team Productivity & Workload Dashboard in Google Sheets?
Click to Buy Team Productivity & Workload Dashboard in Google Sheets
The Team Productivity & Workload Dashboard is a centralized reporting tool that tracks productivity metrics, task distribution, hours worked, and monthly performance.
Team Productivity & Workload Dashboard in Google Sheets
It simplifies workload management by providing real-time insights into team progress, priority-level tasks, performance categories, and monthly trends.
With this dashboard, you can instantly see how the team is performing, how many tasks are pending, how time is spent, and whether the workload is evenly distributed.
Dashboard Structure
This dashboard is organized into multiple sections and analysis pages. Each page provides a specific insight into team performance and workload behavior.
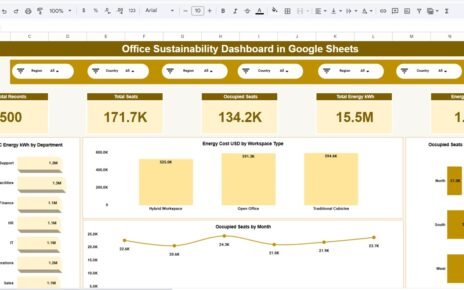
Overview Sheet Tab
This is the main dashboard page and offers a quick snapshot of overall productivity.
Team Productivity & Workload Dashboard in Google Sheets
Card:
-
Total Task
-
Completed Task
-
Avg. Target Hours
-
Avg. Actual Hours
-
In Progress Task
Chart:
-
In Progress Task by Task Type
-
Total Task by Priority
-
Avg. Actual Hours by Month
-
Pending Task by Assigned By
These charts help team leaders identify workload bottlenecks, monitor priority levels, and understand time usage trends.

Click to Buy Team Productivity & Workload Dashboard in Google Sheets
Task Analysis
This section focuses on task-level breakdowns across different task categories.
Task Analysis
Chart:
-
Avg. Target Hours by Task Type
-
Avg. Actual Hours by Task Type
-
Total Task by Task Type
This analysis reveals which task types require more time, which categories dominate workload, and whether actual hours exceed planned target hours.

Performance Analysis
This tab evaluates team performance by tracking productivity and task completion patterns.
Performance Analysis
Chart:
-
Pending Task by Performance
-
Completed Task by Performance
-
Total Task by Performance
This helps leadership understand which performance groups are meeting expectations and which require additional support or training.

Click to Buy Team Productivity & Workload Dashboard in Google Sheets
Team Analysis
This section highlights team-level workload patterns and productivity insights.
Team Analysis
Chart:
-
Avg. Target Hours by Team
-
Avg. Actual Hours by Team
-
Total Task by Team
It helps managers identify overworked or underutilized teams and balance workloads more effectively.

Monthly Trends
This section displays monthly workflow behavior and performance.
Monthly Trends
Chart:
-
Pending Task by Month
-
Completed Task by Month
-
Total Task by Month
This view helps teams understand seasonal workload peaks and productivity dips over time.

Click to Buy Team Productivity & Workload Dashboard in Google Sheets
Search Sheet Tab
The Search Tab provides a quick method to locate any task without scrolling through long data lists.
Search Features:
-
Search by Keyword
-
Search by Field Name (Task Type, Assigned By, Priority, Team, Performance Category, etc.)
This search tool enhances data accessibility and speeds up decision-making.

Data Sheet Tab
This sheet contains complete task-level data, including:
- Task Name
- Task Type
- Assigned By
- Assigned To
- Target Hours
- Actual Hours
- Priority
- Team
- Performance Rating
- Status
- Month
All dashboard visuals and KPIs are auto-generated based on this data.

Click to Buy Team Productivity & Workload Dashboard in Google Sheets
Advantages of Team Productivity & Workload Dashboard in Google Sheets
📊 Real-Time Visibility
Monitor workload, task progress, and performance instantly.
⚡ Improved Resource Allocation
Identify overloaded teams and redistribute tasks efficiently.
⏱ Time Management Insights
Compare target hours vs. actual hours for productivity optimization.
📌 Priority-Level Monitoring
Track how many high, medium, or low priority tasks are completed or pending.
📅 Clear Monthly Trends
Spot workflow peaks and low-productivity periods for better planning.
☁️ Cloud-Based Collaboration
Easily share with managers and team members to maintain transparency.
Opportunities for Improvement
Click to Buy Team Productivity & Workload Dashboard in Google Sheets
-
Add a KPI Scorecard for productivity scoring
-
Use conditional formatting to highlight critical delays
-
Include charts for overutilized vs. underutilized team members
-
Add automated notifications for overdue tasks
-
Integrate with Google Forms for quick task entry
Best Practices
-
Update task status regularly for accurate reporting
-
Compare actual hours with target hours weekly
-
Use monthly trends to adjust workload planning
-
Track performance categories to develop training plans
-
Maintain consistent naming in the data sheet for clean reporting
Conclusion
Click to Buy Team Productivity & Workload Dashboard in Google Sheets
The Team Productivity & Workload Dashboard in Google Sheets is a powerful tool for managing team performance and balancing workloads. With task-level insights, team analysis, performance charts, and monthly trends, this dashboard helps managers maintain transparency, optimize productivity, and ensure teams stay aligned with goals.
Visit our YouTube channel to learn step-by-step video tutorials
Youtube.com/@NeotechNavigators
Watch the step-by-step video Demo:
Click to Buy Team Productivity & Workload Dashboard in Google Sheets