In today’s healthcare landscape, telehealth has become an essential service for providing remote care to patients. To ensure the effectiveness and efficiency of telehealth services, healthcare providers need to track and measure various performance indicators. The Telehealth KPI Dashboard in Google Sheets is a powerful tool designed to monitor key performance indicators (KPIs) and provide insights into telehealth service delivery. This article will walk you through the key features of the Telehealth KPI Dashboard, explain the KPIs tracked, and guide you on how to make the most of this template for effective telehealth management.
What is a Telehealth KPI Dashboard?
A Telehealth KPI Dashboard is a visual tool used to track key metrics related to telehealth services. By using KPIs, healthcare providers can measure critical aspects of telehealth performance such as patient engagement, service delivery, response times, and patient satisfaction. The Google Sheets dashboard helps you monitor these metrics in real-time, providing a centralized platform for decision-making, performance analysis, and continuous improvement.
Key Features of the Telehealth KPI Dashboard in Google Sheets
The Telehealth KPI Dashboard in Google Sheets includes six key worksheets designed to track and visualize telehealth metrics:
1. Dashboard Sheet Tab
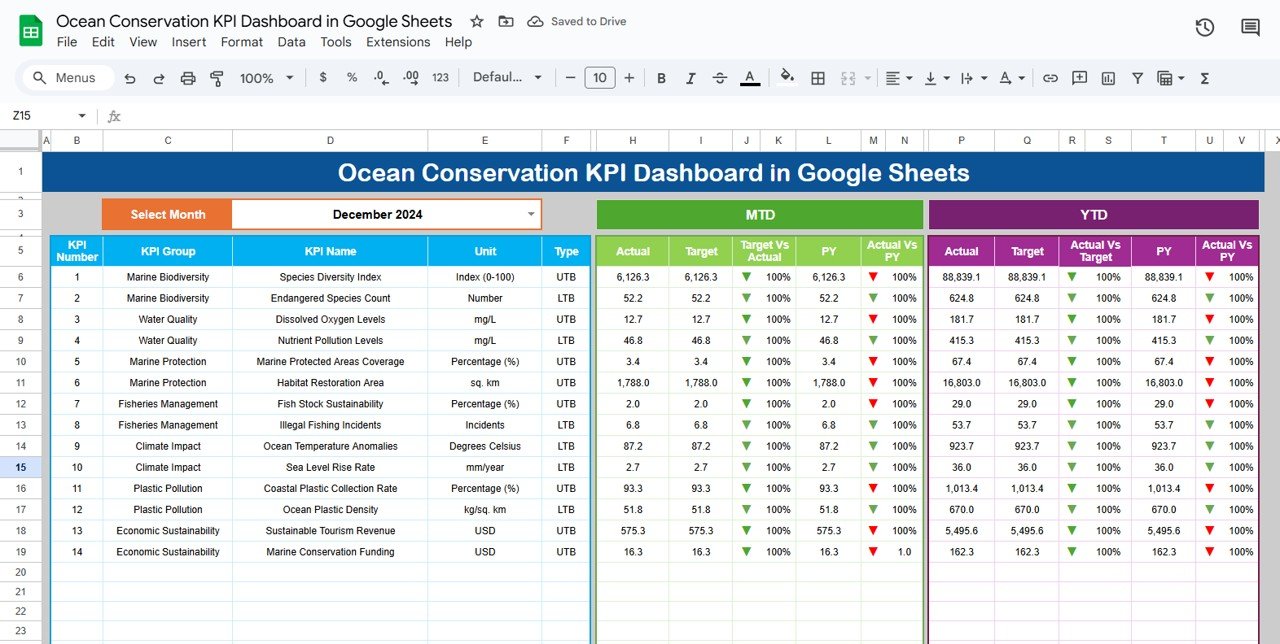
The Dashboard Sheet is the main sheet where you can view all the important KPIs and performance metrics. Key features include:
Month Dropdown (D3): Select the month to view updated data for the selected period. The dashboard will automatically adjust to display the MTD (Month-to-Date) and YTD (Year-to-Date) data.
Metrics Displayed:
- MTD Actual, Target, Previous Year Data: Displays the actual data for the current month compared with the target and data from the same period in the previous year.
- YTD Actual, Target, Previous Year Data: Displays year-to-date data for the current year compared with the target and previous year’s data.
Conditional Formatting: The dashboard uses up and down arrows to indicate whether KPIs meet the target, providing a quick visual cue of performance.

Click to buy Telehealth KPI Dashboard in Google Sheets
2. KPI Trend Sheet Tab
The KPI Trend Sheet allows you to analyze trends over time. Key features include:
-
KPI Selection Dropdown (C3): Select a specific KPI to view its historical data.
-
KPI Group: The group to which the KPI belongs (e.g., Patient Satisfaction, Service Response Time).
-
Unit: The unit of measurement for the KPI (e.g., number of patients, minutes).
-
KPI Type: Indicates whether the KPI is a “Lower the Better” (LTB) or “Upper the Better” (UTB) metric.
-
Formula and Definition: Displays the formula for calculating the KPI and a detailed definition of what the KPI measures.

Click to buy Telehealth KPI Dashboard in Google Sheets
3. Actual Numbers Sheet Tab
The Actual Numbers Sheet is where you input the actual performance data for your KPIs:
-
YTD and MTD Input: Enter the actual data for the year-to-date (YTD) and month-to-date (MTD) metrics.
-
Month Selector (E1): Select the first month of the year to update the dashboard and input data accordingly.

4. Target Sheet Tab
In the Target Sheet, you input the target values for each KPI:
-
Monthly and YTD Targets: Enter the target numbers for each KPI for both MTD and YTD performance, allowing you to track how well you’re meeting your goals.

Click to buy Telehealth KPI Dashboard in Google Sheets
5. Previous Year Number Sheet Tab
This sheet allows you to input the previous year’s data for comparison:
-
Comparison with Previous Year: Enter the previous year’s data to compare it with the current year’s performance and identify trends or areas needing improvement.

6. KPI Definition Sheet Tab
The KPI Definition Sheet is where you define each KPI:
-
KPI Name, Group, Unit: Define the name, group, and unit of measurement for each KPI.
-
Formula and Definition: Provide a clear explanation of the formula used to calculate the KPI and its definition for a better understanding of its relevance.

Advantages of Using the Telehealth KPI Dashboard
The Telehealth KPI Dashboard offers several benefits for healthcare providers managing telehealth services:
-
Real-Time Insights: The dashboard allows you to track KPIs in real-time, providing immediate insights into service delivery and performance.
-
Improved Decision-Making: By visualizing data and trends, the dashboard helps healthcare providers make data-driven decisions to improve service quality and patient satisfaction.
-
Efficient Monitoring: The dashboard centralizes all relevant KPIs, enabling easy tracking of key metrics like response time, patient satisfaction, and appointment completion.
-
Customizable: The template is fully customizable, allowing you to tailor it to the specific needs of your telehealth practice.
-
User-Friendly: The Google Sheets platform is easy to use, even for those with minimal technical experience.
Opportunity for Improvement in the Telehealth KPI Dashboard
Click to buy Telehealth KPI Dashboard in Google Sheets
While the Telehealth KPI Dashboard provides valuable insights, there are opportunities for further enhancement:
-
Integration with Health Data Systems: Integrating the dashboard with electronic health records (EHR) or telehealth platforms could automate data entry, reducing manual work and ensuring accuracy.
-
Advanced Analytics: Adding predictive analytics features could help forecast patient demand, optimize appointment scheduling, and predict patient outcomes.
-
Mobile-Friendly Version: Developing a mobile version of the dashboard would enable telehealth providers to access key metrics while on the go.
-
More KPIs: Adding additional KPIs, such as medication adherence or patient follow-up rates, could provide a more comprehensive view of telehealth performance.
Best Practices for Using the Telehealth KPI Dashboard
To get the most out of the Telehealth KPI Dashboard, consider these best practices:
-
Regularly Update Data: Keep the dashboard up to date by regularly inputting actual data for MTD and YTD metrics.
-
Focus on Key KPIs: Focus on the most critical KPIs that impact patient satisfaction and operational efficiency.
-
Review Trends: Use the KPI Trend Sheet to monitor performance trends over time and identify areas for improvement.
-
Set Realistic Targets: Ensure that targets for each KPI are realistic and achievable based on past performance.
-
Share with Your Team: Share the dashboard with relevant team members to ensure alignment on goals and performance expectations.
Conclusion
Click to buy Telehealth KPI Dashboard in Google Sheets
The Telehealth KPI Dashboard in Google Sheets is an invaluable tool for managing and monitoring telehealth services. By tracking key performance indicators like patient satisfaction, appointment completion, and response time, healthcare providers can improve their service delivery, enhance patient outcomes, and optimize operational efficiency. With its user-friendly design and customizable features, this dashboard is an essential resource for any telehealth practice looking to stay organized and make data-driven decisions.
Frequently Asked Questions (FAQs)
1. What KPIs does the Telehealth KPI Dashboard track?
The dashboard tracks KPIs like patient satisfaction, appointment completion rate, first call resolution rate, response time, and more.
2. Can I customize the Telehealth KPI Dashboard?
Yes, the dashboard is fully customizable. You can modify KPIs, adjust formulas, and tailor the layout to fit your telehealth service needs.
3. How do I enter data into the Telehealth KPI Dashboard?
Data is entered into the Actual Numbers Sheet for MTD and YTD values. You can also input target numbers and previous year data in the relevant sheets.
4. Can the Telehealth KPI Dashboard be automated?
While the dashboard doesn’t automatically pull data, you can integrate it with other systems (like EHR) for automated data input and updates.
5. How often should I update the data in the Telehealth KPI Dashboard?
It’s recommended to update the dashboard regularly (e.g., weekly or monthly) to ensure the data is up-to-date and accurate for decision-making.
Visit our YouTube channel to learn step-by-step video tutorials