Managing a theater requires monitoring ticket sales, audience engagement, show schedules, and operational efficiency. The Theater Management KPI Dashboard in Google Sheets provides a ready-to-use solution for tracking key performance indicators (KPIs), analyzing trends, and making data-driven decisions.Theater Management KPI Dashboard in Google Sheets
In this article, we will explain the features, advantages, best practices, and frequently asked questions related to this dashboard.Theater Management KPI Dashboard in Google Sheets
What Is a Theater Management KPI Dashboard in Google Sheets?
A Theater Management KPI Dashboard is a visual and interactive tool that consolidates performance metrics in a single Google Sheet. It allows theater managers to monitor operations such as ticket sales, audience satisfaction, occupancy rates, and show performance.
With this dashboard, managers can:
-
Track MTD (Month-to-Date) and YTD (Year-to-Date) performance
-
Compare actual numbers with targets and previous year data
-
Monitor trends by show, audience type, or location
-
Make informed decisions to improve profitability and audience experience
Key Features of the Theater Management KPI Dashboard
Click to Buy Theater Management KPI Dashboard in Google Sheets
This dashboard contains six worksheets, each designed for a specific purpose:
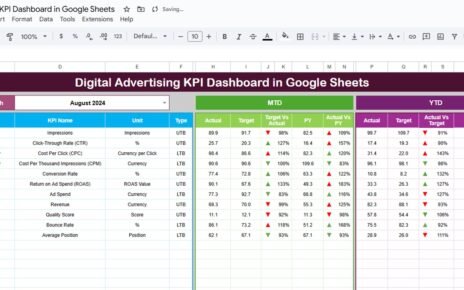
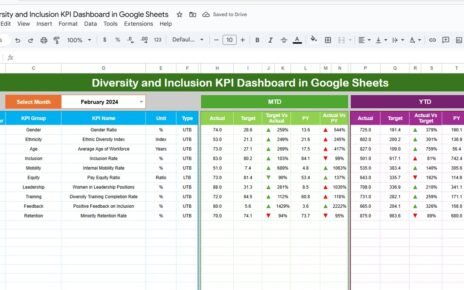
1. Dashboard Sheet Tab
The Dashboard Sheet provides a high-level overview of all KPIs.
Key features include:
-
Month Selection Dropdown (Range D3): Updates dashboard numbers dynamically for the selected month
-
MTD Metrics: Actual, target, and previous year data with conditional formatting arrows for quick insights
-
YTD Metrics: Aggregate data for the year-to-date with visual indicators
This sheet allows managers to monitor all theater operations in one glance.

Click to Buy Theater Management KPI Dashboard in Google Sheets
2. KPI Trend Sheet Tab
The KPI Trend Sheet provides detailed analytics for each KPI:
-
Select a KPI from the dropdown in Range C3
-
Displays KPI Group, Unit, Type (Lower-the-Better or Upper-the-Better)
-
Shows the KPI formula and definition
-
Visualizes trends over time for performance evaluation
This sheet is useful for identifying underperforming areas and monitoring improvements.

3. Actual Number Sheet Tab
-
Enter actual numbers for each KPI for MTD and YTD
-
Update the first month of the year in Range E1 to dynamically adjust calculations
This sheet ensures accurate reporting of real performance metrics.

Click to Buy Theater Management KPI Dashboard in Google Sheets
4. Target Sheet Tab
-
Enter monthly and yearly targets for each KPI
-
Supports comparison of actual performance versus planned goals
Maintaining clear targets helps managers measure success and identify gaps.

5. Previous Year Numbers Sheet Tab
-
Enter previous year data for each KPI
-
Enables year-over-year comparisons to track growth and performance trends
This sheet is essential for understanding seasonal trends and performance improvements.

Click to Buy Theater Management KPI Dashboard in Google Sheets
6. KPI Definition Sheet Tab
-
Document KPI Name, Group, Unit, Formula, Definition, and Type (Upper-the-Better or Lower-the-Better)
-
Ensures consistency in measurement and clarity in reporting
This sheet serves as a reference guide for all KPIs in the dashboard.

Examples of KPIs for Theater Management
Some important KPIs to track using this dashboard include:
-
Ticket Sales ($): Total revenue from ticket bookings
-
Audience Attendance (%): Percentage of seats occupied per show
-
Show Occupancy Rate: Tracks occupancy across different shows
-
Revenue per Show ($): Revenue generated per performance
-
Customer Satisfaction Score: Audience feedback and satisfaction ratings
-
Operational Costs ($): Expenses per show or month
-
Marketing Campaign Effectiveness (%): Conversion rate from campaigns
Each KPI should include:
-
Unit of Measure (e.g., $, %, count)
-
Formula (e.g., Tickets Sold ÷ Total Capacity)
-
Performance Type (Upper-the-Better / Lower-the-Better)
Advantages of Using the Theater Management KPI Dashboard
Click to Buy Theater Management KPI Dashboard in Google Sheets
-
Centralized Performance Data: Track all KPIs in one Google Sheet
-
Real-Time Insights: Update numbers and instantly see changes in dashboards
-
Trend Analysis: Monitor monthly and yearly performance for strategic planning
-
Identify Bottlenecks: Highlight shows or areas with low attendance or revenue
-
Improve Decision-Making: Allocate resources based on data-driven insights
-
Customizable: Adjust KPIs, formulas, or targets based on your theater’s needs
Best Practices for Using the Dashboard
-
Update Data Regularly: Ensure all ticket sales, attendance, and feedback data are entered promptly
-
Segment KPIs: Track metrics by show, location, audience type, or marketing campaign
-
Monitor Trends: Use month-to-month and year-over-year comparisons for better insights
-
Analyze Audience Engagement: Identify patterns in attendance and satisfaction
-
Set Clear Targets: Ensure KPIs are measurable and align with theater goals
-
Use Conditional Formatting: Highlight key metrics for quick understanding
How This Dashboard Helps Theater Managers
Click to Buy Theater Management KPI Dashboard in Google Sheets
-
Monitor Revenue: Track ticket sales and revenue trends
-
Evaluate Show Performance: Identify high-performing and low-performing shows
-
Analyze Audience Engagement: Review attendance, satisfaction, and demographic trends
-
Plan Resources Efficiently: Allocate staff and resources based on booking and occupancy data
-
Improve Marketing Strategy: Use KPI trends to plan campaigns and promotions
Frequently Asked Questions (FAQs)
Click to Buy Theater Management KPI Dashboard in Google Sheets
Q1: Can I customize the KPIs in this dashboard?
Yes, the dashboard is fully customizable. You can add, remove, or adjust KPIs based on your theater’s focus.
Q2: How often should data be updated?
Ideally, update the data monthly to track trends and compare against targets effectively.
Q3: Can I track performance by location or show type?
Yes, you can filter data by show, location, or audience type for detailed insights.
Q4: Does the dashboard show trends over time?
Yes, the KPI Trend sheet visualizes month-to-month and year-to-date trends for each KPI.
Q5: Is this dashboard suitable for multiple theaters?
Absolutely. You can replicate the sheets for multiple locations and compare performance across venues.
Conclusion
The Theater Management KPI Dashboard in Google Sheets provides a comprehensive, visual solution for monitoring theater operations. With MTD and YTD metrics, trend analysis, and clear KPI definitions, this dashboard helps theater managers optimize performance, enhance audience engagement, and make data-driven decisions.
Visit our YouTube channel to learn step-by-step video tutorials
Youtube.com/@NeotechNavigators
Watch the step-by-step video Demo:
Click to Buy Theater Management KPI Dashboard in Google Sheets