Managing training programs, budgets, and expenditures becomes challenging when organizations run multiple sessions across various departments. The Training Financial Planning Dashboard in Google Sheets provides a real-time, structured, and ready-to-use solution for tracking financial performance and training operations in one centralized dashboard.
Training Financial Planning Dashboard in Google Sheets
This dashboard helps HR teams, L&D departments, finance teams, and training coordinators analyze budget allocation, training performance, trainer effectiveness, and overspending trends — all through automated visual charts.
What Is a Training Financial Planning Dashboard in Google Sheets?
The Training Financial Planning Dashboard is a data-driven tool designed to monitor training budgets, utilization, program-wise spending, and performance across departments.
Training Financial Planning Dashboard in Google Sheets
It enables teams to understand whether training programs stay within budget, which departments overspend, and how training duration varies across categories.
With this dashboard, you can instantly evaluate budget variances, spending trends, training counts, and trainer contributions.
Dashboard Structure
Click to Buy Training Financial Planning Dashboard in Google Sheets
This dashboard includes multiple sheets to organize data, visualize insights, and help users navigate training finances efficiently.
Overview Sheet Tab
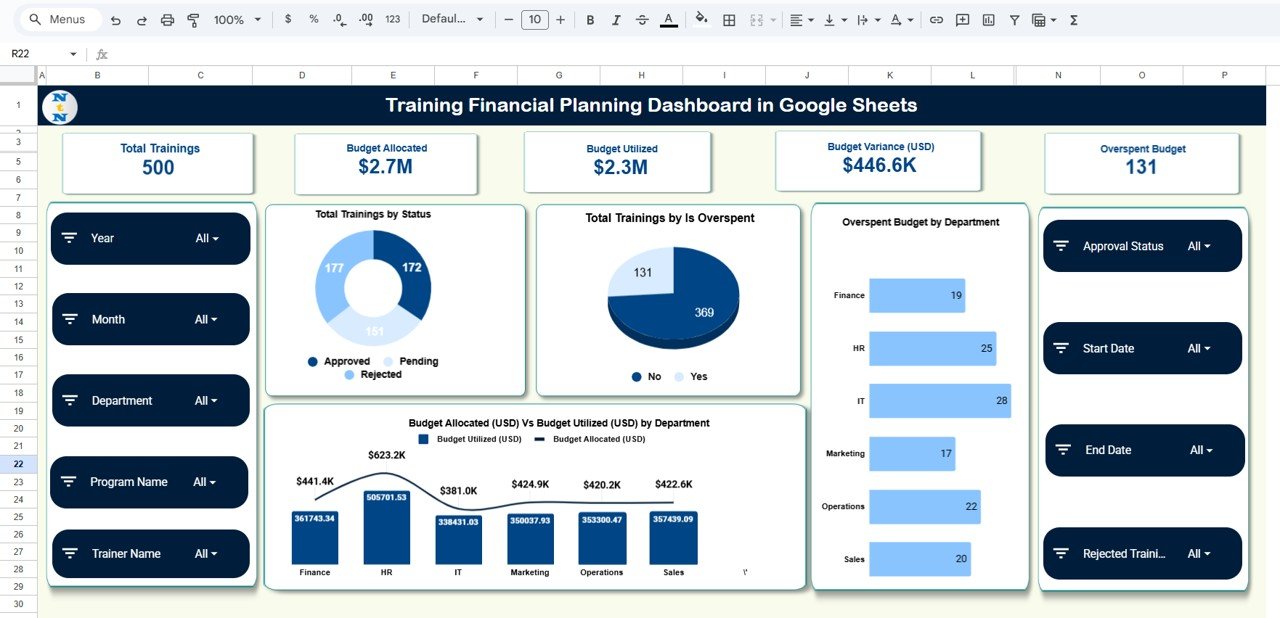
This is the main dashboard that displays a financial and operational summary of all training programs.
Training Financial Planning Dashboard in Google Sheets
Card:
-
Total Trainings
-
Budget Allocated
-
Budget Utilized
-
Budget Variance (USD)
-
Overspent Budget
Chart:
-
Total Trainings by Status
-
Total Trainings by Is Overspent
-
Budget Allocated (USD) Vs Budget Utilized (USD) by Department
-
Overspent Budget by Department
These visuals help identify financial gaps, overspending issues, and overall training activity.
Click to Buy Training Financial Planning Dashboard in Google Sheets
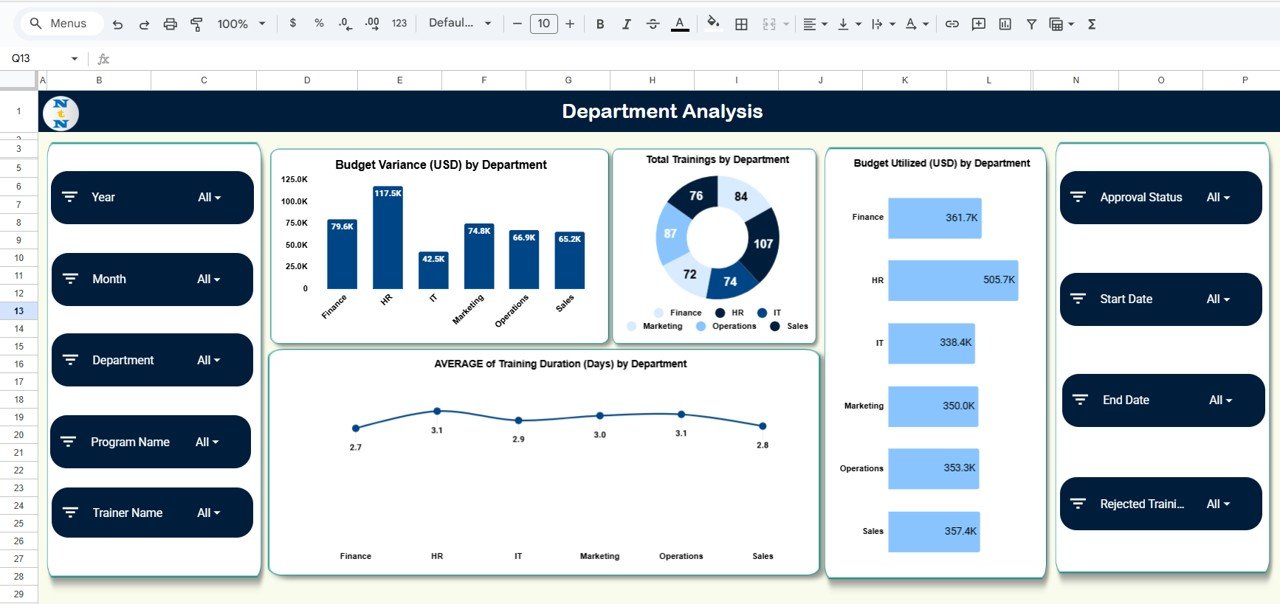
Department Analysis
This section focuses on department-level spending and training trends.
Department Analysis
Chart:
-
Budget Variance (USD) by Department
-
Total Trainings by Department
-
Budget Utilized (USD) by Department
-
AVERAGE of Training Duration (Days) by Department
This helps teams understand which departments stay within budget, which require additional investment, and where training durations differ.
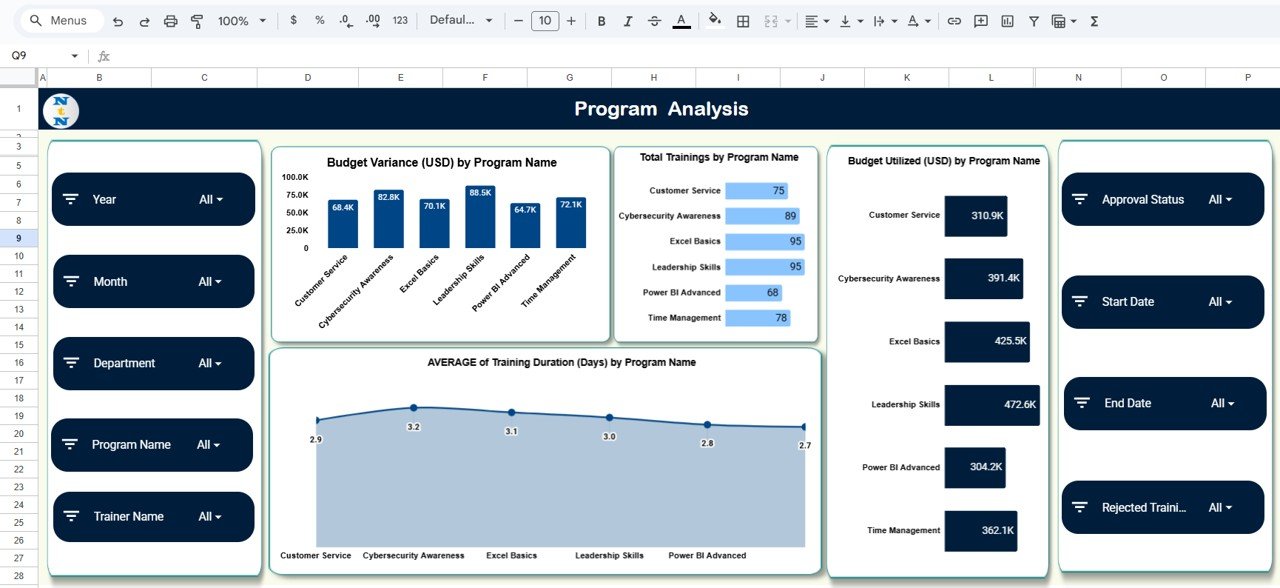
Program Analysis
This tab analyzes training programs individually to highlight financial and performance patterns.
Program Analysis
Chart:
-
Budget Variance (USD) by Program Name
-
Total Trainings by Program Name
-
Budget Utilized (USD) by Program Name
-
AVERAGE of Training Duration (Days) by Program Name
Click to Buy Training Financial Planning Dashboard in Google Sheets
This helps identify which programs are cost-effective, which require more control, and which deliver longer or shorter durations.
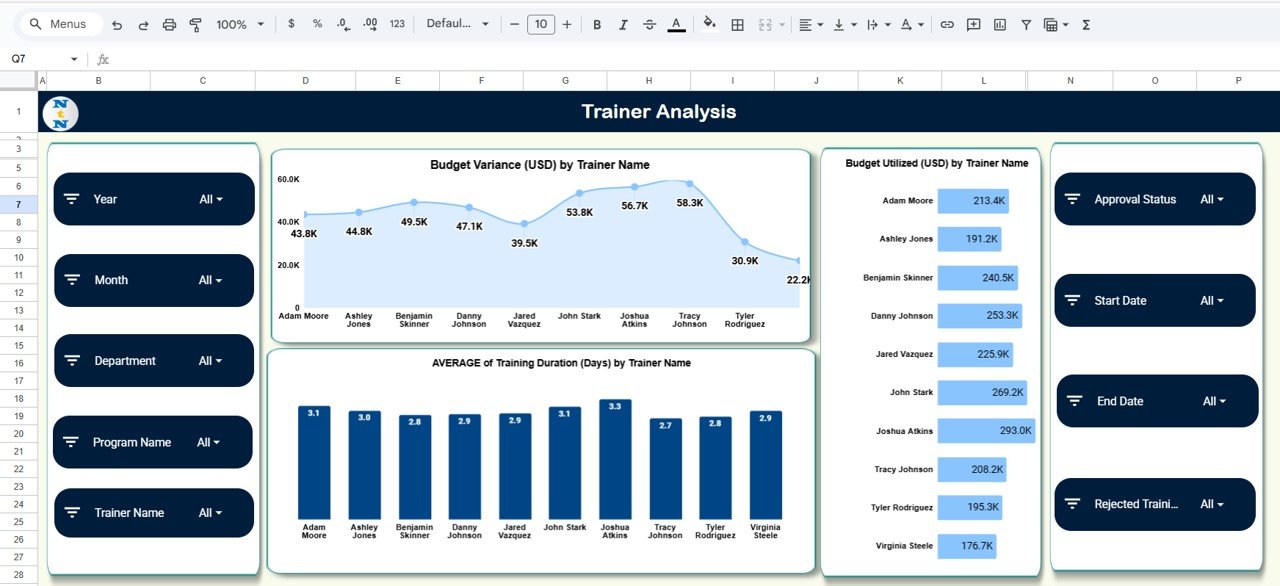
Trainer Analysis
This section provides insights into trainer efficiency, cost utilization, and training duration.
Trainer Analysis
Chart:
-
Budget Variance (USD) by Trainer Name
-
Budget Utilized (USD) by Trainer Name
-
AVERAGE of Training Duration (Days) by Trainer Name
This helps identify high-performing trainers and highlight cost-heavy trainers.
Click to Buy Training Financial Planning Dashboard in Google Sheets
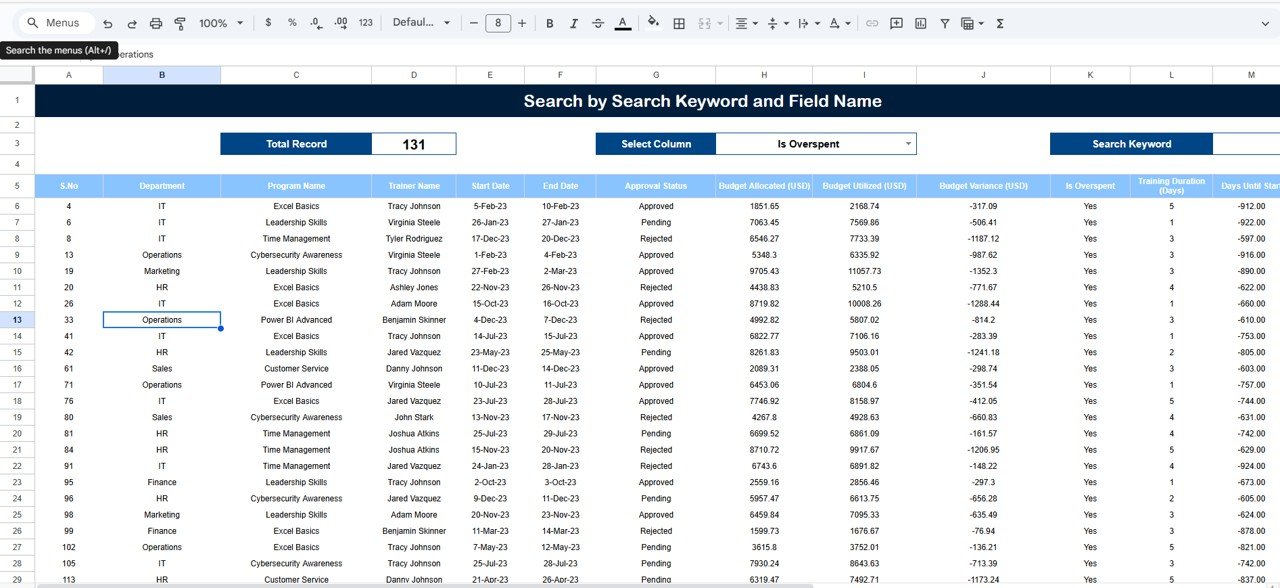
Search Sheet Tab
This tab allows users to search for any training record easily.
Search Features:
-
Search by Keyword
-
Search by Field Name (Trainer Name, Department, Program Name, Status, Duration, etc.)
The search tool helps users quickly access specific training records without scrolling through long data lists.
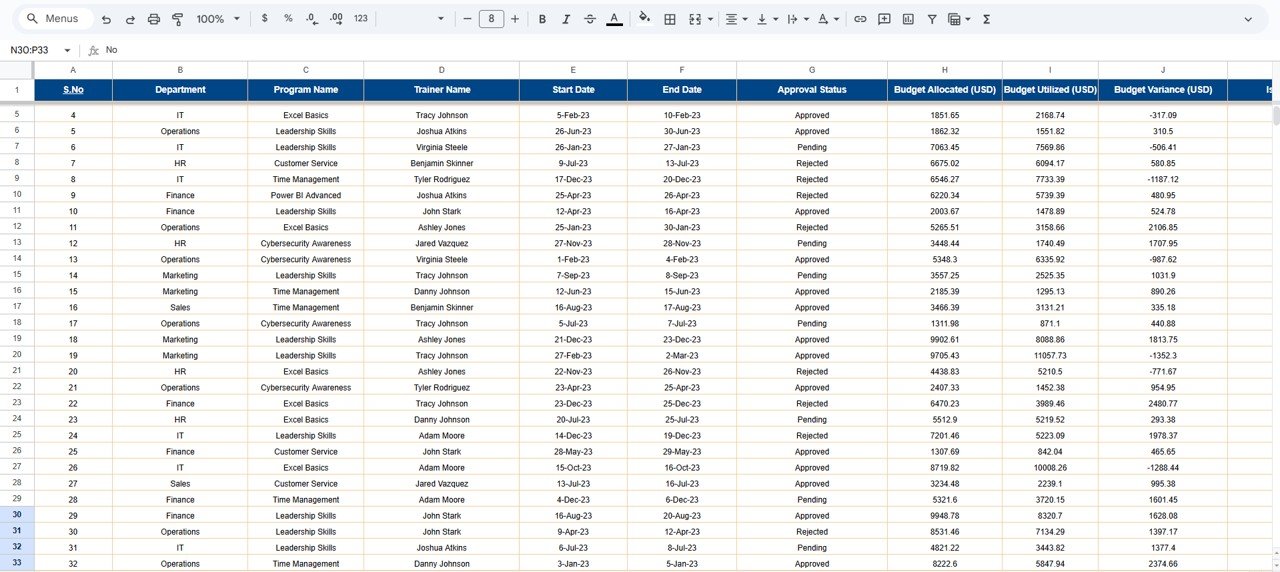
Data Sheet Tab
This sheet stores the master dataset and includes fields such as:
-
Training Name
-
Department
-
Program Name
-
Trainer Name
-
Budget Allocated
-
Budget Utilized
-
Duration (Days)
-
Status
-
Is Overspent
-
Month
-
Year
All visual charts and KPIs are powered by this data.
Click to Buy Training Financial Planning Dashboard in Google Sheets
Advantages of Training Financial Planning Dashboard in Google Sheets
📊 Complete Budget Visibility
Monitor allocated budgets, actual utilization, and variances in real time.
🎯 Track Overspending
Quickly identify overspent departments and high-cost programs.
📅 Improve Training Operations
Understand training duration trends and completion patterns.
🏢 Department & Program Insights
View spending and training activity at a detailed level.
☁️ Cloud-Based Collaboration
Multiple teams (HR + Finance) can update data simultaneously.
Opportunities for Improvement
Click to Buy Training Financial Planning Dashboard in Google Sheets
-
Add cost-per-training and cost-per-employee KPIs
-
Include month-wise budget utilization trends
-
Add automated alerts for overspent programs
-
Integrate with Google Forms to capture new training requests
-
Add trainer rating and feedback analysis
Best Practices
Click to Buy Training Financial Planning Dashboard in Google Sheets
-
Update budget utilization and duration after each training
-
Compare overspent programs over multiple months
-
Use department-level insights to adjust yearly training budgets
-
Track trainer-wise performance to improve content delivery
-
Review program-wise cost patterns quarterly
Conclusion
The Training Financial Planning Dashboard in Google Sheets provides HR, L&D, and finance teams with complete visibility into training budgets, spending, and program performance. With department-level insights, trainer analytics, clear budget variance charts, and overspending indicators, this dashboard ensures better planning, cost control, and efficient execution of training activities.
Visit our YouTube channel to learn step-by-step video tutorials
Youtube.com/@NeotechNavigators
Watch the step-by-step video Demo:
Click to Buy Training Financial Planning Dashboard in Google Sheets