In today’s fast-paced transportation industry, ensuring safety is a top priority. With increasing traffic and complex logistics operations, monitoring safety through key performance indicators (KPIs) has become essential. The Transportation Safety KPI Dashboard in Google Sheets provides an easy-to-use, comprehensive tool to track and manage safety metrics effectively. This article will guide you through the features, key performance indicators (KPIs), best practices, and the opportunity for improvement in this dashboard. Whether you’re a fleet manager, safety officer, or transportation analyst, this dashboard is a game-changer for ensuring safety standards are met.
What is a Transportation Safety KPI Dashboard?
A Transportation Safety KPI Dashboard is a tool designed to monitor key metrics that assess the safety of transportation operations. It helps track performance related to accidents, compliance, driver behavior, vehicle maintenance, and other critical safety factors. The dashboard provides real-time insights, enabling decision-makers to take action quickly to improve safety standards.
Transportation Safety KPI Dashboard in Google Sheets is a customizable, ready-to-use template that integrates seamlessly with Google Sheets. It allows you to track and analyze transportation safety metrics effortlessly, offering a complete view of your fleet’s safety performance.
Key Features of the Transportation Safety KPI Dashboard
The dashboard consists of six powerful worksheets that provide a comprehensive overview of your transportation safety metrics:
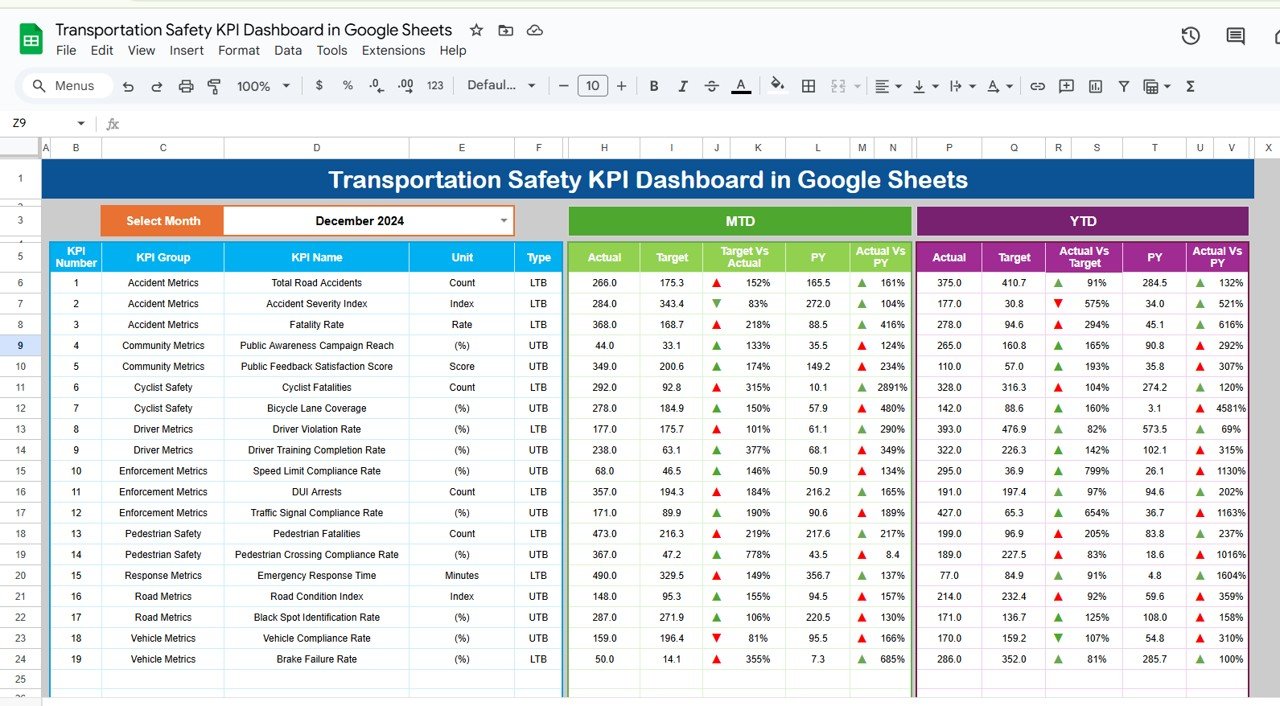
Dashboard Sheet Tab:
- This is the main sheet where all key safety metrics are displayed.
- A dropdown allows you to select the month, and the dashboard updates all numbers accordingly.
- It includes MTD (Month-to-Date) and YTD (Year-to-Date) actuals, targets, and previous year data.
- Target vs. Actual and Previous Year vs. Actual performance are presented with conditional formatting to highlight areas of improvement (up/down arrows).
Click to buy Transportation Safety KPI Dashboard in Google Sheets
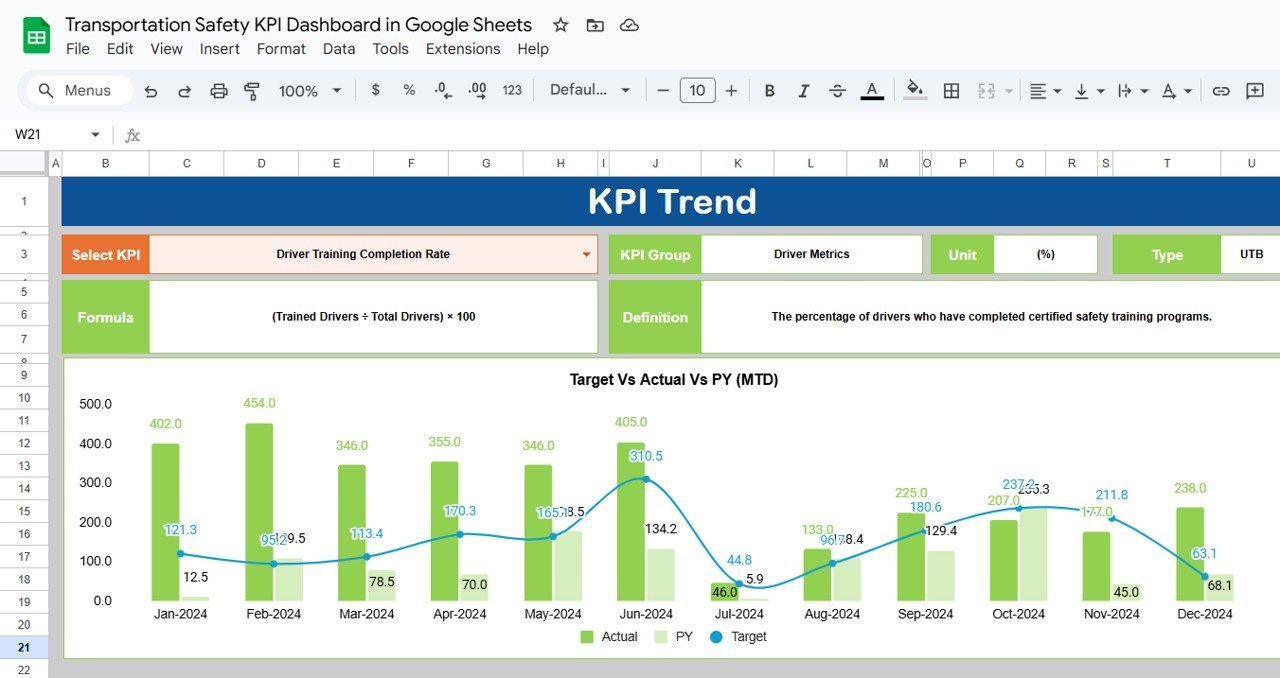
KPI Trend Sheet Tab:
- Allows you to select any KPI from a dropdown to view detailed metrics.
- Displays the KPI Group, Unit of Measure, KPI Type (whether “Lower the Better” or “Upper the Better”), Formula, and Definition for each KPI.
Click to buy Transportation Safety KPI Dashboard in Google Sheets
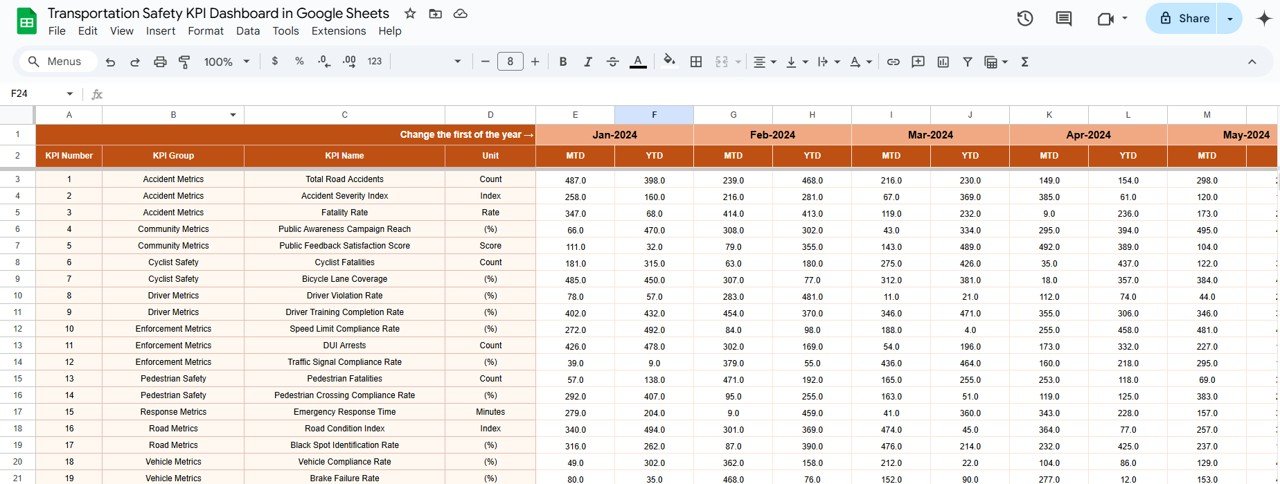
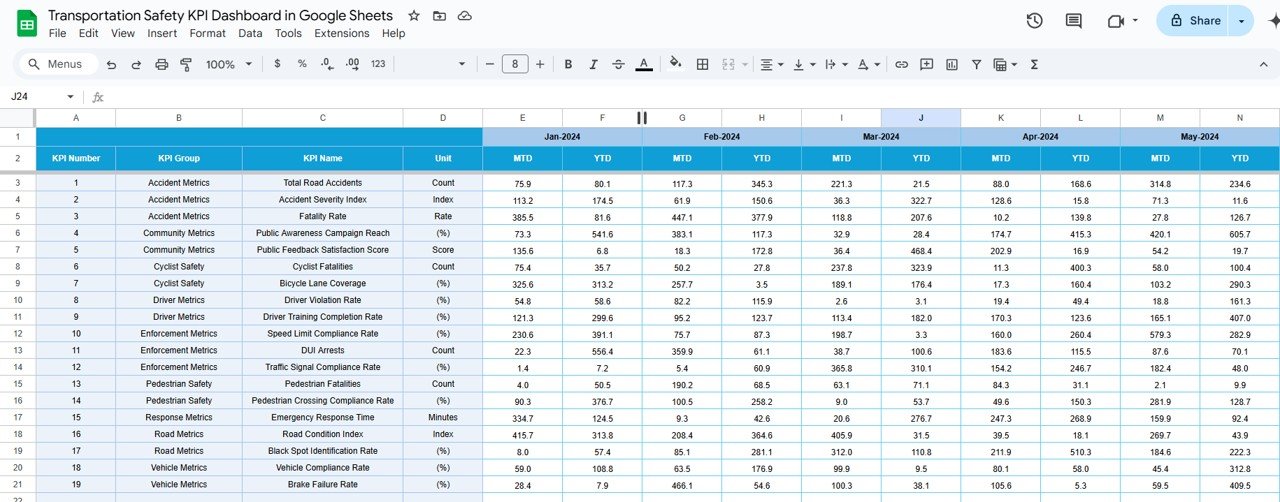
Actual Number Sheet Tab:
- This sheet is where you enter actual data for MTD and YTD for the selected month.
- Simply change the first month of the year (on Range E1) to input data for a specific month.
Target Sheet Tab:
- Enter target numbers for each KPI for both MTD and YTD in this tab.
Click to buy Transportation Safety KPI Dashboard in Google Sheets
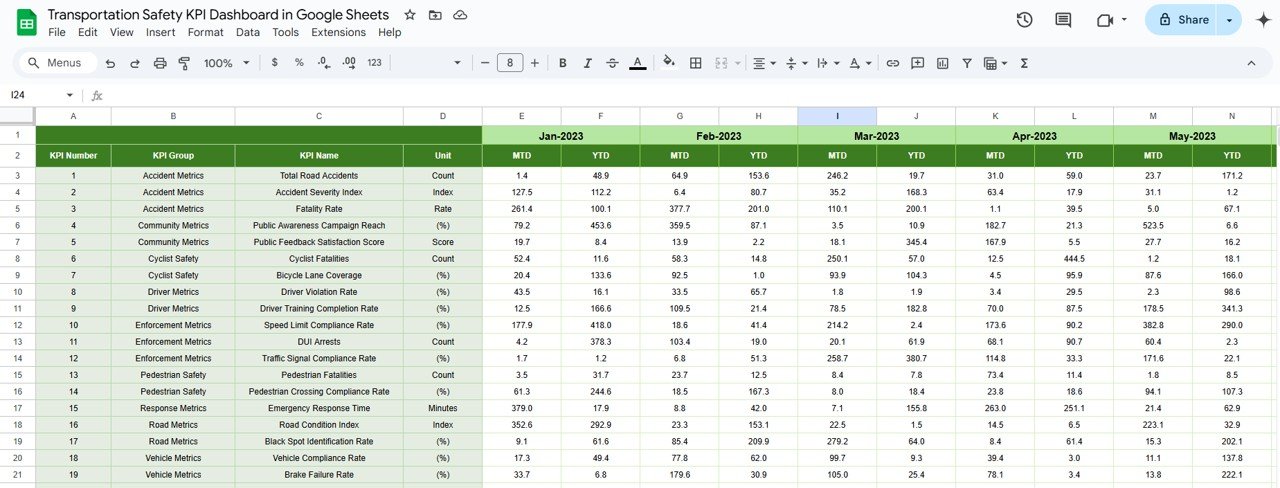
Previous Year Number Sheet Tab:
- Here, input previous year data to track performance comparison with the current year.
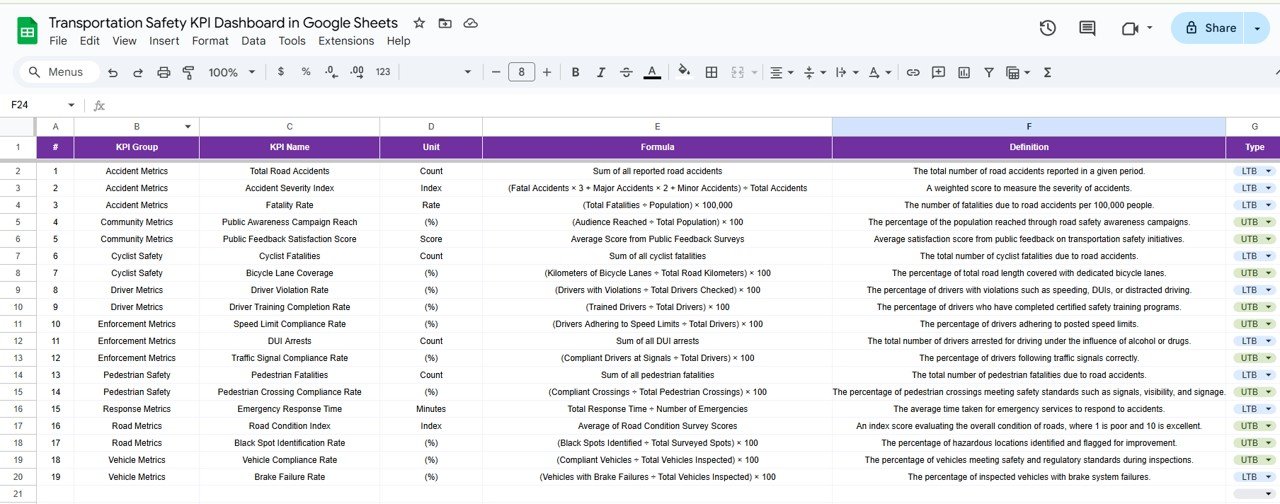
KPI Definition Sheet Tab:
- This sheet defines each KPI in terms of name, group, unit of measurement, formula, and definition, ensuring clarity and understanding of each metric.
Click to buy Transportation Safety KPI Dashboard in Google Sheets
Advantages of Using a Transportation Safety KPI Dashboard
Using a Transportation Safety KPI Dashboard offers several benefits that can significantly improve safety performance within a transportation organization.
-
Real-Time Insights:
With the ability to view MTD, YTD, and previous year data in real-time, fleet managers and safety officers can quickly identify safety issues and take immediate action. -
Improved Decision-Making:
By providing data-driven insights, the dashboard supports informed decision-making, helping management prioritize safety initiatives effectively. -
Increased Compliance:
Tracking key safety metrics such as accident rates and vehicle compliance ensures that the organization stays within legal and regulatory safety requirements. -
Enhanced Safety Culture:
By consistently monitoring and improving safety KPIs, organizations foster a culture of safety among drivers, fleet managers, and support staff. -
Cost Reduction:
Monitoring metrics like accident rates, speeding violations, and maintenance scores can help reduce costs related to accidents, legal fines, and vehicle repairs.
Opportunities for Improvement in Transportation Safety
Click to buy Transportation Safety KPI Dashboard in Google Sheets
While the Transportation Safety KPI Dashboard is a powerful tool for managing safety metrics, there is always room for improvement. Here are some opportunities for optimization:
-
Data Integration:
Integrating real-time data from GPS tracking systems or telematics devices could further enhance the accuracy and timeliness of safety data. -
Driver Training Programs:
Analyzing KPIs related to driver behavior (such as speeding violations and safety scores) can highlight areas for driver training and improvement. -
Predictive Analytics:
By implementing predictive analytics, fleet managers can anticipate potential safety issues before they occur, allowing for proactive management. -
Regular Updates and Maintenance:
Regular updates to the KPI definitions, formulas, and targets can help adapt the dashboard to evolving industry standards and safety requirements.
Best Practices for Using the Transportation Safety KPI Dashboard
Click to buy Transportation Safety KPI Dashboard in Google Sheets
To get the most out of the Transportation Safety KPI Dashboard, follow these best practices:
-
Regular Data Entry:
Ensure that actual numbers are entered regularly (monthly, weekly, or as needed) to keep the dashboard up to date. -
Use the Trend Analysis Sheet:
Continuously monitor KPIs over time to identify trends and make adjustments to safety strategies as needed. -
Set Realistic Targets:
Ensure that your target numbers are challenging but achievable, and adjust them based on historical data and industry benchmarks. -
Actionable Insights:
Use the dashboard not just to track data, but to take action. If KPIs indicate underperformance, develop a plan to address the issue. -
Engage Stakeholders:
Share the dashboard with relevant stakeholders, including drivers, fleet managers, and senior executives, to keep everyone informed and accountable.
Conclusion
The Transportation Safety KPI Dashboard in Google Sheets is an invaluable tool for monitoring, managing, and improving transportation safety across your fleet. With its comprehensive features and customizable structure, it enables transportation organizations to stay on top of critical safety metrics, enhance performance, and reduce risks. By using the dashboard to track KPIs like accident rates, vehicle compliance, and driver safety scores, you ensure that safety remains a top priority in every aspect of your operations.
Frequently Asked Questions (FAQs)
Click to buy Transportation Safety KPI Dashboard in Google Sheets
1. What is the purpose of a Transportation Safety KPI Dashboard?
The Transportation Safety KPI Dashboard is designed to help organizations track and manage key safety metrics within the transportation industry, such as accident rates, driver behavior, vehicle maintenance, and more.
2. How can I use the dashboard effectively?
To use the dashboard effectively, regularly update the actual numbers for MTD and YTD, review the trend analysis, and take action on any areas that fall below the set targets.
3. Can I customize the dashboard for my specific needs?
Yes, the dashboard is customizable, and you can adjust the KPIs, targets, and data input sheets to fit your specific transportation safety requirements.
4. What are the benefits of tracking KPIs like vehicle maintenance and accident rates?
Tracking KPIs like vehicle maintenance and accident rates helps improve safety, reduce costs, ensure compliance, and foster a safety culture within the organization.
5. Is the Transportation Safety KPI Dashboard compatible with other data sources?
While the dashboard is designed for use with Google Sheets, you can integrate it with other data sources like GPS tracking or telematics systems for enhanced functionality.
Visit our YouTube channel to learn step-by-step video tutorials
Youtube.com/@NeotechNavigators
Watch the step-by-step video Demo:
Click to buy Transportation Safety KPI Dashboard in Google Sheets