Efficient vendor management is crucial for businesses to ensure timely deliveries, maintain quality, and control costs. Monitoring supplier performance allows organizations to identify the best partners, reduce risks, and improve procurement efficiency. That’s why we developed the Vendor Performance Dashboard in Google Sheets — a ready-to-use solution to track all critical vendor KPIs in one interactive sheet.
What is the Vendor Performance Dashboard in Google Sheets?
The Vendor Performance Dashboard in Google Sheets is a comprehensive tool designed for procurement teams, supply chain managers, and vendor managers. It helps track purchase orders, spending, delivery performance, and vendor ratings. By consolidating all metrics in one dashboard, it allows users to monitor trends, compare vendor performance, and make data-driven decisions efficiently.
This dashboard is ideal for companies looking to optimize vendor performance and maintain high standards in procurement operations.
Key Features of the Vendor Performance Dashboard
Click to Buy Vendor Performance Dashboard in Google Sheets
The dashboard consists of three sheets, each designed for a specific function:
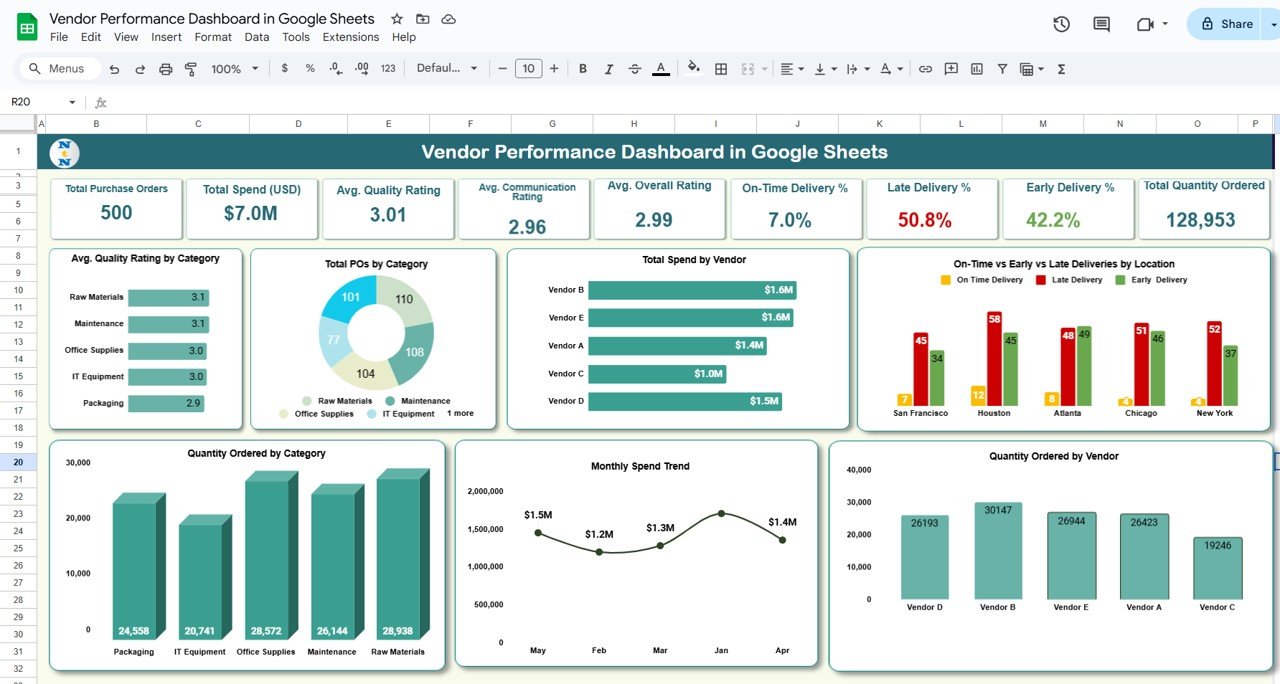
1. Dashboard Sheet Tab
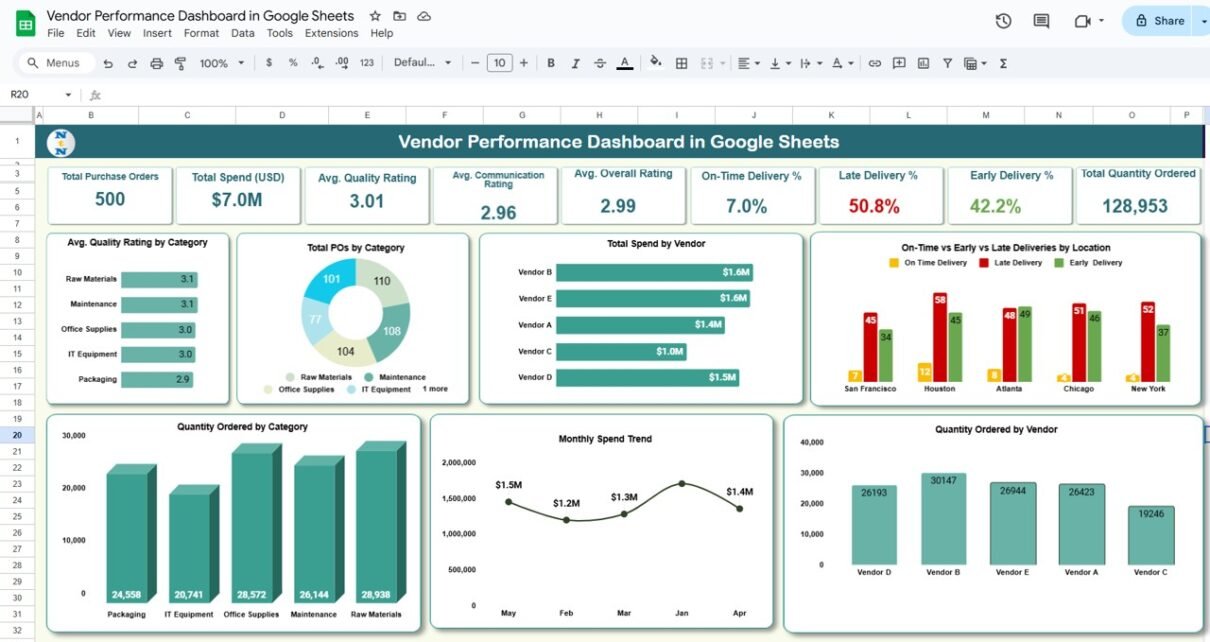
This is the main sheet where all KPIs and visualizations are displayed.
Features Include:
Cards for Quick Insights:
- Total Purchase Orders
- Total Spend (USD)
- Average Quality Rating
- Average Communication Rating
- Average Overall Rating
- On-Time Delivery %
- Late Delivery %
- Early Delivery %
- Total Quantity Ordered
Category & Vendor Analysis:
- Avg. Quality Rating by Category
- Total POs by Category
- Total Spend by Vendor
- Quantity Ordered by Vendor
- Quantity Ordered by Category
Delivery & Trend Analysis:
- On-Time vs Early vs Late Deliveries by Location
- Monthly Spend Trend
Click to Buy Vendor Performance Dashboard in Google Sheets
Interactive Search: Filter data by delivery status, vendor, category, or month.
This sheet provides a visual and interactive view of all critical vendor performance metrics.
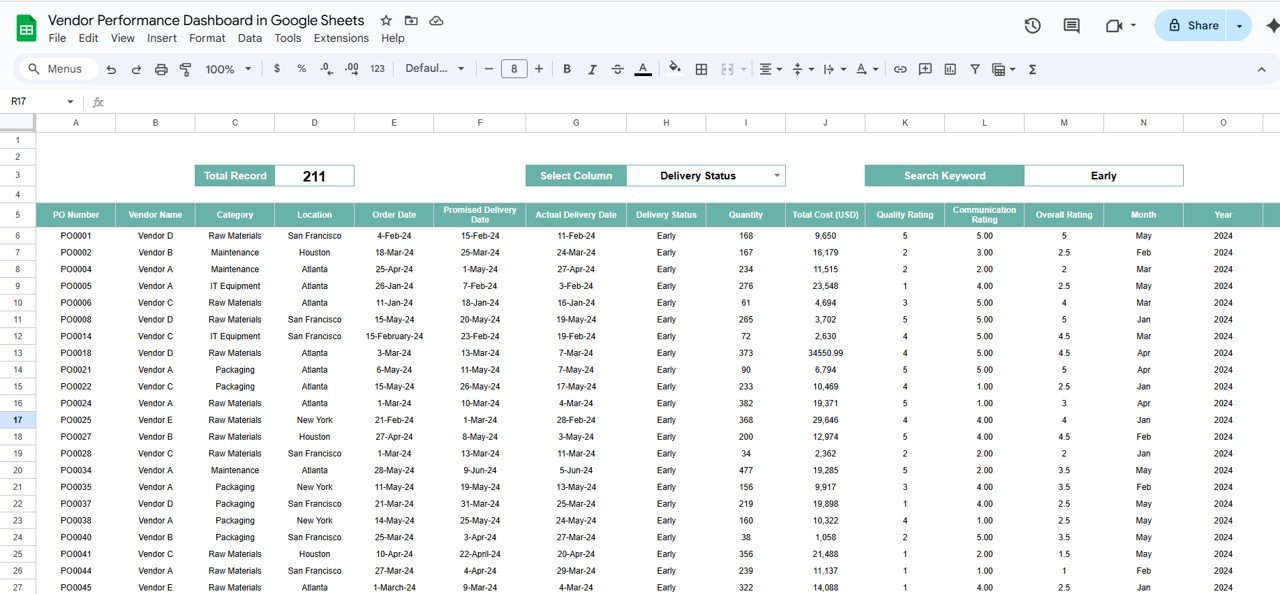
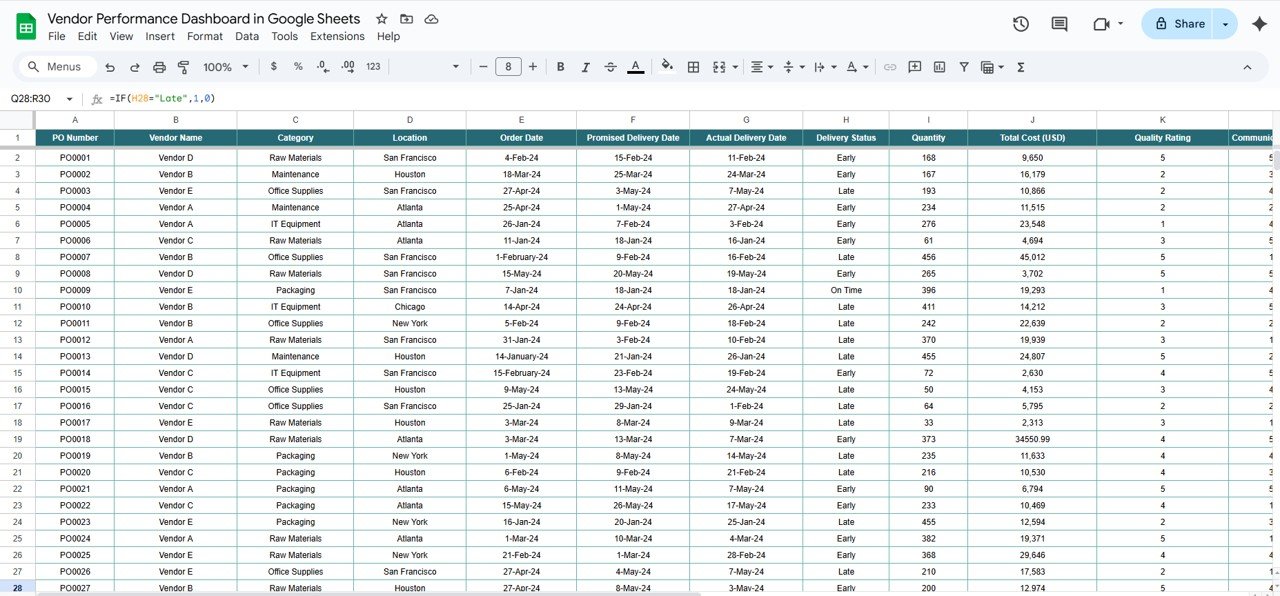
2. Data Sheet Tab
This sheet acts as the database for all purchase order data.
Captured Information Includes:
- PO Number
- Vendor Name
- Category
- Location
- Order Date, Promised Delivery Date, Actual Delivery Date
- Delivery Status (On-Time, Early, Late)
- Quantity Ordered
- Total Cost (USD)
- Quality Rating
- Communication Rating
- Overall Rating
- Month & Year
This structured dataset allows the dashboard to calculate KPIs dynamically and generate charts and insights.
Click to Buy Vendor Performance Dashboard in Google Sheets
Advantages of Using This Dashboard
-
Centralized Vendor Management: Consolidate all supplier data in a single sheet.
-
Data-Driven Decisions: Monitor KPIs to identify high-performing vendors.
-
Performance Insights: Track quality, communication, and delivery efficiency.
-
Trend Analysis: Compare monthly or yearly vendor performance.
-
Customizable: Add new metrics or adjust calculations to suit your procurement strategy.
Best Practices for Vendor KPI Management
Click to Buy Vendor Performance Dashboard in Google Sheets
-
Update Data Regularly: Record purchase orders, costs, and ratings promptly.
-
Monitor Delivery Metrics: Track early, on-time, and late deliveries to mitigate supply chain risks.
-
Analyze Trends: Use YTD and MTD metrics to identify performance patterns.
-
Standardize Ratings: Maintain consistent rating definitions for quality, communication, and overall performance.
Conclusion
The Vendor Performance Dashboard in Google Sheets is an essential tool for procurement teams, supply chain managers, and organizations looking to enhance supplier performance. By combining all critical KPIs in one interactive dashboard, you can track purchase orders, spending, and delivery performance efficiently. Make data-driven decisions and strengthen your vendor management strategy with this powerful dashboard.
Visit our YouTube channel to learn step-by-step video tutorials
Youtube.com/@NeotechNavigators
Watch the step-by-step video Demo: