In today’s content-driven world, video production has become an essential part of business strategy, marketing, education, and entertainment. Whether you are a content creator, agency, or corporate team, measuring performance is key to scaling production and improving outcomes. This is where a Video Production KPI Dashboard in Google Sheets can help.Video Production KPI Dashboard in Google Sheets
This easy-to-use dashboard template helps you track, analyze, and improve all your key video production metrics in one place. With automated calculations, interactive visualizations, and editable sheets, it becomes the go-to performance tracker for modern video teams.Video Production KPI Dashboard in Google Sheets
What Is a Video Production KPI Dashboard in Google Sheets?
Click to buy Video Production KPI Dashboard in Google Sheets
A Video Production KPI Dashboard is a centralized tool that enables video teams to monitor their production performance against set targets and historical data. Built in Google Sheets, this template provides flexibility, real-time collaboration, and visual clarity.Video Production KPI Dashboard in Google Sheets
The dashboard displays key performance indicators (KPIs) across monthly and yearly views using charts, conditional formatting, dropdown filters, and dynamic formulas.Video Production KPI Dashboard in Google Sheets
With just a few entries in the actual, target, and previous year sheets, users can get a complete overview of:
-
Monthly performance (MTD)
-
Year-to-date performance (YTD)
-
Target achievement
-
Year-over-year comparison
Key Features of the Dashboard Template
This dashboard template includes six structured worksheet tabs, each with a specific function:
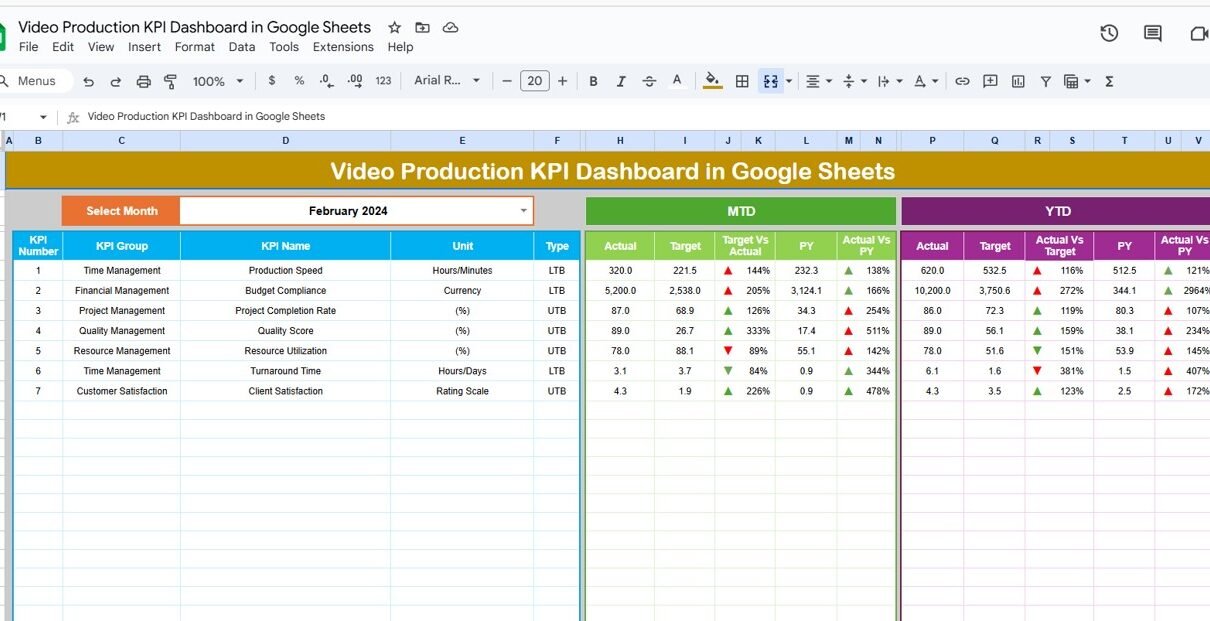
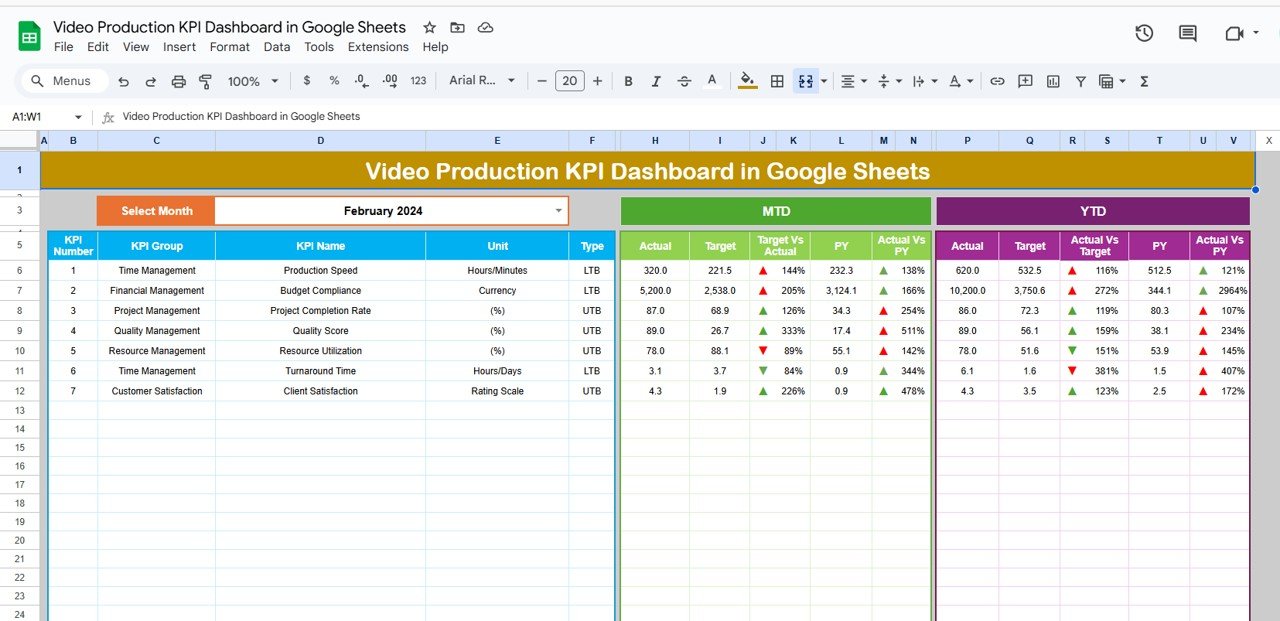
1. Dashboard Sheet Tab
Main analytics page for visualizing all KPIs.
Select the desired month from cell D3 using a dropdown.
- MTD (Month-To-Date): Actual, Target, Previous Year
- YTD (Year-To-Date): Actual, Target, Previous Year
Conditional formatting highlights performance using up/down arrows.
- Target vs Actual
- Actual vs Previous Year
Click to buy Video Production KPI Dashboard in Google Sheets
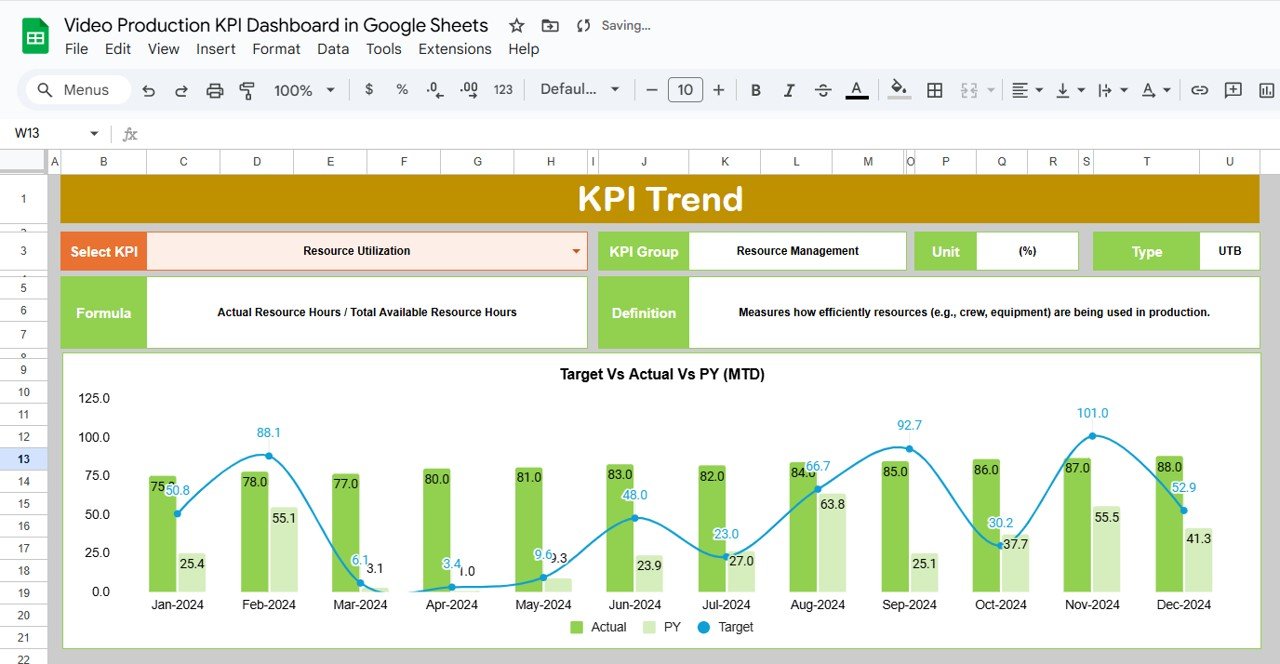
2. KPI Trend Sheet Tab
Select a KPI name from a dropdown (cell C3).
- KPI Group
- Unit
- Type (UTB – Upper the Better, LTB – Lower the Better)
- Formula used
- KPI Definition
Click to buy Video Production KPI Dashboard in Google Sheets
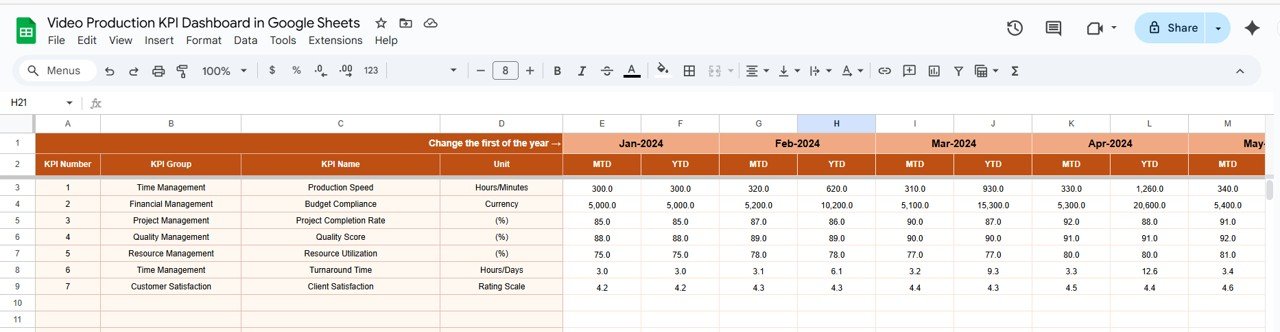
3. Actual Number Sheet Tab
-
Enter monthly MTD and YTD actual values.
-
Select the first month of the year in cell E1 for automated calculations.
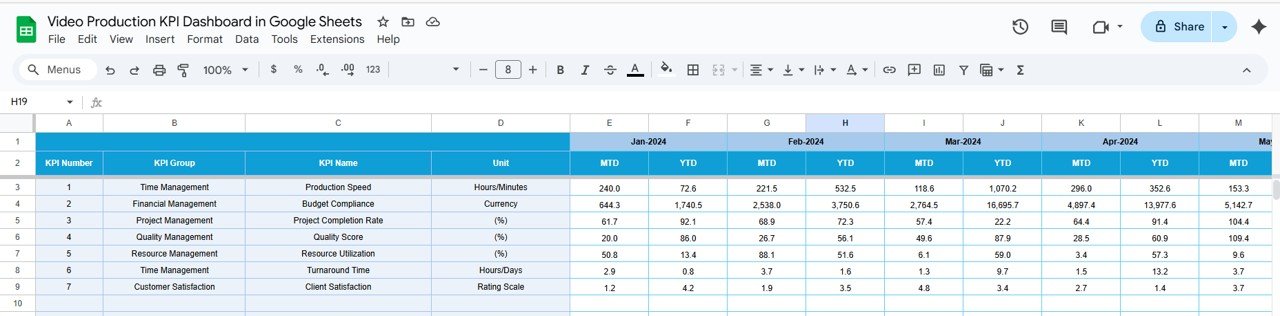
4. Target Sheet Tab
-
Add monthly MTD and YTD targets for each KPI.
-
Use this for setting performance goals and benchmarks.
Click to buy Video Production KPI Dashboard in Google Sheets
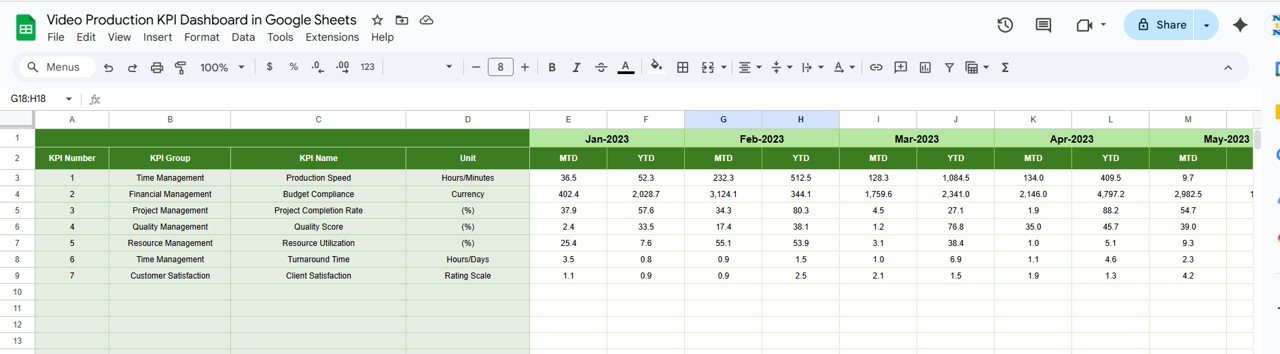
5. Previous Year Number Sheet Tab
-
Input historical data for the same KPIs used this year.
-
Helps measure progress and year-on-year improvement.
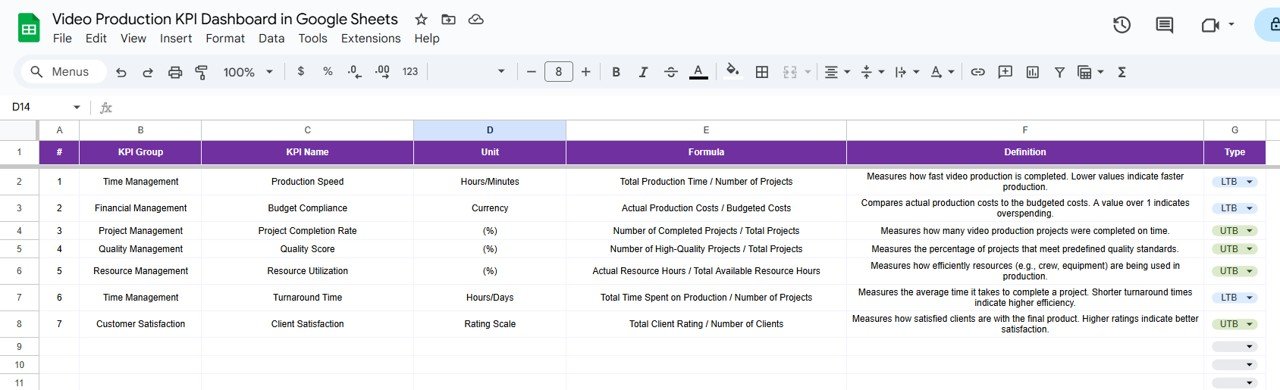
6. KPI Definition Sheet Tab
Maintain a full list of your KPIs with:
- KPI Name
- Group
- Unit
- Formula
- Short Definition
- Type (UTB or LTB)
Click to buy Video Production KPI Dashboard in Google Sheets
Advantages of a Video Production KPI Dashboard
-
Centralized Performance Monitoring:See all your KPIs in one dashboard without flipping through multiple sheets.
-
Real-Time Updates:Changes in input data instantly reflect across all charts and metrics.
-
Better Goal Tracking:Compare actuals against targets and previous year’s numbers.
-
Data-Driven Decision Making:Identify underperformance and take timely action.
-
Team Transparency:Everyone—from editors to managers—can view progress and contribution.
-
Collaboration-Friendly:Built in Google Sheets, so multiple users can work together seamlessly.
Opportunities for Improvement in the Dashboard
While the dashboard is already robust, you can enhance it further with:
-
Weekly Reporting:Add weekly MTD data columns for faster decision-making.
-
Category-Level Breakdown:Segment videos by type (tutorials, ads, product videos, etc.)
-
Geographic Insights:Add columns for regions or countries for global teams.
-
AI-Based Recommendations:Use Google Sheets’ AI (Explore tool) to generate additional insights.
-
Automated Data Entry:Link forms or Google Analytics to auto-populate actual data.
Best Practices for Using This Dashboard
Click to buy Video Production KPI Dashboard in Google Sheets
-
Keep KPI definitions short and clear.
-
Update actual numbers regularly—ideally weekly or monthly.
-
Review KPIs that fall under “Lower the Better” carefully.
-
Always compare against both targets and previous year values.
-
Use conditional formatting as a performance alert.
-
Encourage team-wide access for transparency and alignment.
-
Archive old data each year for a fresh new start.
Conclusion
The Video Production KPI Dashboard in Google Sheets offers an all-in-one, easy-to-manage, and collaborative environment for managing your video production performance. From monitoring deadlines and team efficiency to budgeting and viewer engagement—this dashboard helps you make smarter decisions backed by real data.Video Production KPI Dashboard in Google Sheets
By consistently updating your inputs and monitoring key insights, you ensure that your video content not only gets produced on time but also performs well and supports business goals. So whether you’re a content creator, marketing agency, or video production manager, this Google Sheets dashboard is your performance powerhouse.Video Production KPI Dashboard in Google Sheets
Frequently Asked Questions (FAQs)
Click to buy Video Production KPI Dashboard in Google Sheets
What is the purpose of a Video Production KPI Dashboard?
A video production KPI dashboard helps track production metrics like timelines, cost, efficiency, and content performance to ensure better output and alignment with business goals.
Can I customize the dashboard according to my team’s needs?
Yes, the dashboard is fully customizable. You can add, edit, or remove KPIs and modify chart layouts or data ranges as per your project requirements.
How often should I update the data?
You should update MTD and YTD data monthly at a minimum. For more responsive tracking, weekly updates are even better.
Is this dashboard suitable for small teams or freelancers?
Absolutely. The simplicity of Google Sheets and its collaborative nature makes this dashboard ideal for both individuals and teams of any size.
What skills do I need to use this dashboard?
Basic Google Sheets knowledge is enough. The dashboard uses dropdowns, formulas, and conditional formatting but does not require advanced coding or scripting skills.
Visit our YouTube channel to learn step-by-step video tutorials
Youtube.com/@NeotechNavigators
Watch the step-by-step video Demo:
Click to buy Video Production KPI Dashboard in Google Sheets