In today’s fast-changing education and workforce development landscape, vocational training institutes play a vital role in equipping students with industry-ready skills. These institutes handle massive amounts of performance data — from student enrollment and attendance to certification success rates and placement outcomes. However, managing and analyzing these metrics manually can become time-consuming and error-prone.
That’s where the Vocational Training KPI Dashboard in Google Sheets becomes an essential tool.
This ready-to-use digital dashboard helps administrators, trainers, and management teams track, measure, and analyze all key performance indicators (KPIs) related to training programs. With its automated formulas, dynamic charts, and easy-to-navigate structure, this dashboard transforms raw data into actionable insights — ensuring that every training initiative delivers measurable results.
Click to buy Vocational Training KPI Dashboard in Google Sheets
What Is a Vocational Training KPI Dashboard in Google Sheets?
A Vocational Training KPI Dashboard is a smart analytics solution built in Google Sheets that helps training institutions visualize their performance metrics in one place. It brings together all critical indicators — such as enrollment trends, dropout rates, trainer performance, student satisfaction, and job placement rates — and converts them into clear, interactive visuals.
Because it’s hosted in Google Sheets, the dashboard offers real-time collaboration, secure cloud access, and easy data sharing with teams across departments. With just a few clicks, users can view Month-to-Date (MTD) and Year-to-Date (YTD) summaries, compare results with targets and previous year data, and quickly identify improvement areas.
Key Features of the Vocational Training KPI Dashboard in Google Sheets
This KPI Dashboard includes six powerful worksheets, each serving a specific purpose. Here’s a breakdown of what’s inside:
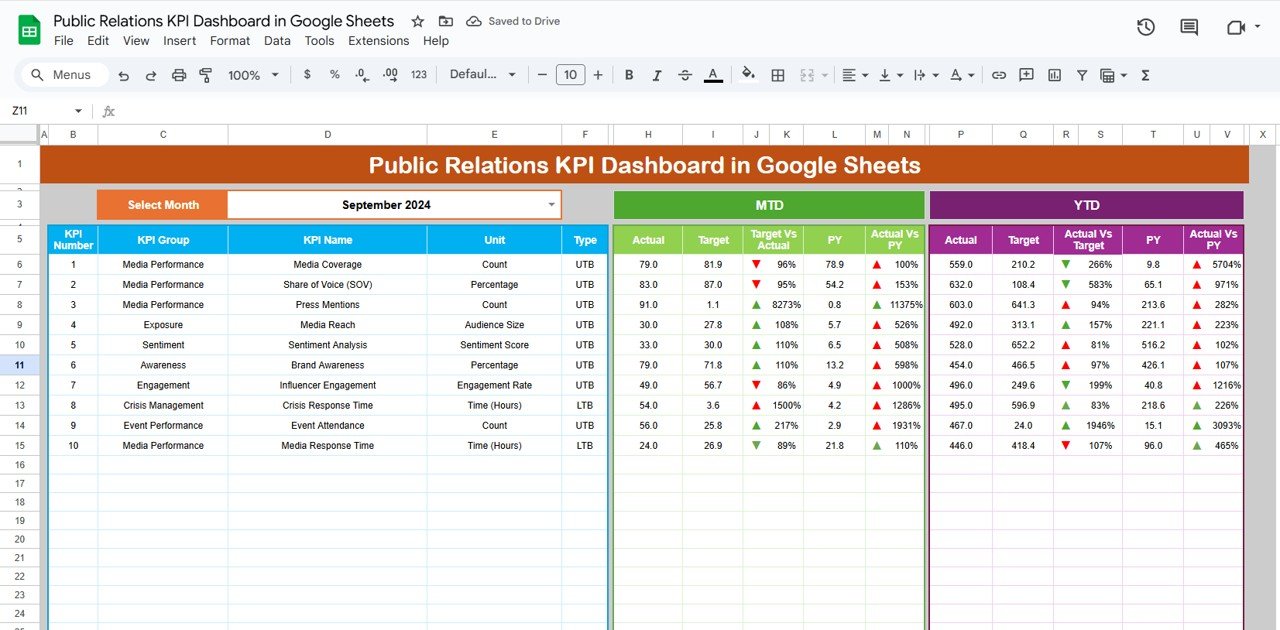
Dashboard Sheet
- The main control panel of the entire system.
- A month selector (cell D3) allows users to choose the month from a dropdown. Once selected, all visuals and data update automatically.
- Displays both MTD and YTD figures for Actuals, Targets, and Previous Year (PY) values.
- Includes conditional formatting with green/red arrows to show whether performance is improving or declining.
- Gives an instant snapshot of training efficiency, placement outcomes, and student progress.

Click to buy Vocational Training KPI Dashboard in Google Sheets
Trend Sheet
- Allows users to select a KPI (from the dropdown in C3) and analyze its trends over time.
- Displays KPI group, unit, type (UTB or LTB), formula, and definition for full clarity.
- Includes visual trend charts comparing Actual, Target, and Previous Year data for both MTD and YTD.
- Perfect for identifying long-term performance patterns or seasonal variations.

Click to buy Vocational Training KPI Dashboard in Google Sheets
Actual Numbers Input Sheet
- Used for entering the actual performance data.
- The month reference is set in cell E1 — enter the first month of the year here to auto-adjust formulas.
- Includes both MTD and YTD columns to record actuals for each KPI.
- Simplifies data input with consistent formatting and formula references.

Click to buy Vocational Training KPI Dashboard in Google Sheets
Target Sheet
- Here, teams define monthly and annual targets for each KPI.
- Enables precise goal-setting for enrollment, completion, job placement, or trainer performance metrics.
- Supports data-driven target comparisons in the Dashboard sheet.

Previous Year Numbers Sheet
- Stores the historical data from the previous year for reference.
- Used in the dashboard to calculate growth percentages, year-over-year trends, and performance improvements.

KPI Definition Sheet
- Lists all the KPIs with details such as group name, unit, formula, and definition.
- Acts as a quick reference guide for users who want to understand the purpose of each metric.
- Helps maintain standardization and consistency across the organization.
Why Use a Vocational Training KPI Dashboard?
Using Google Sheets for a KPI dashboard combines simplicity, flexibility, and analytical power. Here’s why it stands out:
- No complex software needed — it runs entirely in Google Sheets.
- Accessible anywhere — trainers and administrators can view and update data remotely.
- Real-time collaboration — multiple users can edit and comment simultaneously.
- Automation with formulas — reduces manual effort and human error.
- Customizable layout — you can add, remove, or modify KPIs as needed.
- Visual analytics — charts and conditional formatting make interpretation faster.
Advantages of Vocational Training KPI Dashboard in Google Sheets
The benefits of using this dashboard extend beyond simple reporting. It fundamentally changes how training performance is managed.
- Data-Driven Decisions
- With automated KPI calculations and visual indicators, managers can quickly identify trends and make data-based decisions.
- Transparency and Accountability
- Since the dashboard is cloud-based, stakeholders — from management to instructors — can view the same performance metrics, promoting accountability.
- Saves Time
- Manual data entry, report preparation, and trend analysis can take hours. The dashboard reduces these tasks to minutes.
- Easy Customization
- Whether your institute offers hospitality training or IT skills programs, you can easily adjust KPIs, layouts, and charts to match your needs.
- Visual Insights
- Color coding, progress bars, and trend charts make complex data simple to understand — even for non-technical users.
- Cost-Effective
- There’s no expensive software license or maintenance fee — just your existing Google account.
How to Use the Vocational Training KPI Dashboard
Follow these simple steps to make the most of your dashboard:
- Open the Template in Google Sheets.
Make a copy of the dashboard file in your Google Drive. - Set the Base Month (E1).
Enter the first month of the financial or academic year in cell E1. - Fill in Actual Numbers.
Input your MTD and YTD data in the “Actual Numbers Input” sheet. - Set Targets.
Go to the “Target” tab and define monthly and annual target values for each KPI. - Enter Previous Year Data.
Input last year’s figures to compare growth and improvement trends. - Explore the Dashboard.
Use the month dropdown in D3 to view different months and analyze the visuals. - Review KPI Trends.
Visit the “Trend” tab to study historical progress of each metric. - Customize the KPI Definitions.
Modify or add KPIs in the “KPI Definition” sheet to tailor it to your institution.
Best Practices for the Vocational Training KPI Dashboard
To maximize the value of your dashboard, follow these expert-recommended best practices:
- Define Clear KPIs
Select metrics that truly reflect your institute’s performance — such as student outcomes, training quality, or job readiness.
- Keep Data Updated
Regularly update your actual and target values to ensure accuracy in your reports.
- Use Consistent Units
Maintain standard units (%, points, ₹, etc.) for easier comparison across time periods.
- Monitor Trends Monthly
Don’t just focus on yearly summaries — review monthly data to spot issues early.
- Involve All Stakeholders
Encourage trainers, coordinators, and administrators to use the dashboard actively.
- Automate Wherever Possible
Use Google Sheets formulas, data validation, and conditional formatting to minimize manual work.
- Protect Your Data
Restrict editing access to authorized users and maintain backups in Drive.
- Visualize Smartly
Use charts sparingly and focus on clarity — too many visuals can overwhelm instead of informing.
How This Dashboard Improves Training Quality
Implementing a Vocational Training KPI Dashboard helps institutes create a continuous improvement loop:
- Trainers review their own performance and identify areas to strengthen.
- Management monitors overall program effectiveness and resource utilization.
- Students indirectly benefit from higher-quality training and better outcomes.
When performance data becomes transparent and accessible, it fosters accountability and promotes a culture of excellence.
Conclusion
The Vocational Training KPI Dashboard in Google Sheets isn’t just a spreadsheet — it’s a strategic tool for continuous improvement. It enables vocational institutions to turn everyday data into meaningful insights, track progress across time, and make data-driven decisions that directly impact training quality and student outcomes.
By combining automation, visualization, and collaboration, this dashboard offers everything you need to streamline monitoring and reporting processes. Whether you manage a single training center or a national skill program, it’s your all-in-one solution for better governance, transparency, and performance tracking.
Frequently Asked Questions (FAQs)
- What is a Vocational Training KPI Dashboard?
It’s a performance monitoring tool built in Google Sheets to track, visualize, and analyze key performance indicators related to training programs.
- Can I customize the KPIs?
Yes! You can easily edit, add, or remove KPIs from the “KPI Definition” sheet to match your organization’s requirements.
- Do I need technical skills to use it?
No, it’s designed for users with basic spreadsheet knowledge. The structure and formulas are already in place.
- How often should I update the data?
It’s best to update data monthly to keep your MTD and YTD analysis current.
- Can I share this dashboard with my team?
Absolutely. Google Sheets allows multiple users to collaborate in real time with controlled permissions.
- Is there a cost to use it?
If you already have a Google account, the dashboard runs completely free inside Google Sheets.
- What makes it better than Excel?
The biggest advantages are real-time collaboration, cloud storage, and automatic updates — features that make Google Sheets perfect for distributed teams.
Visit our YouTube channel to learn step-by-step video tutorials
Watch the step-by-step video tutorial:
Click to buy Vocational Training KPI Dashboard in Google Sheets