Efficient waste management is crucial for both environmental and operational efficiency. The Waste Management KPI Dashboard in Google Sheets is a powerful tool designed to help organizations monitor key performance indicators (KPIs) in their waste management processes. With this dashboard, you can track waste generation, recycling rates, and other essential metrics, ensuring your waste management practices align with sustainability goals.
In this article, we will explore the Waste Management KPI Dashboard in Google Sheets, a ready-to-use template that simplifies tracking and improving waste management practices.
Key Features of the Waste Management KPI Dashboard in Google Sheets
Below are the key features of this KPI dashboard template:
1. Dashboard Sheet Tab
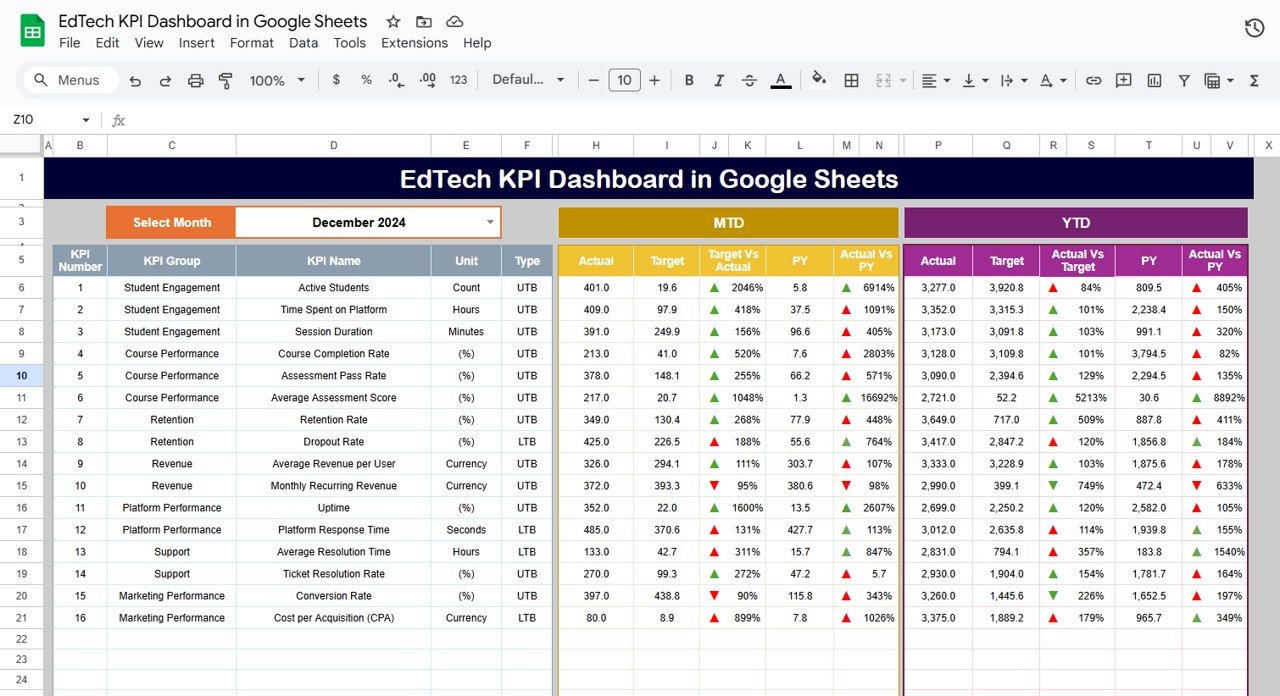
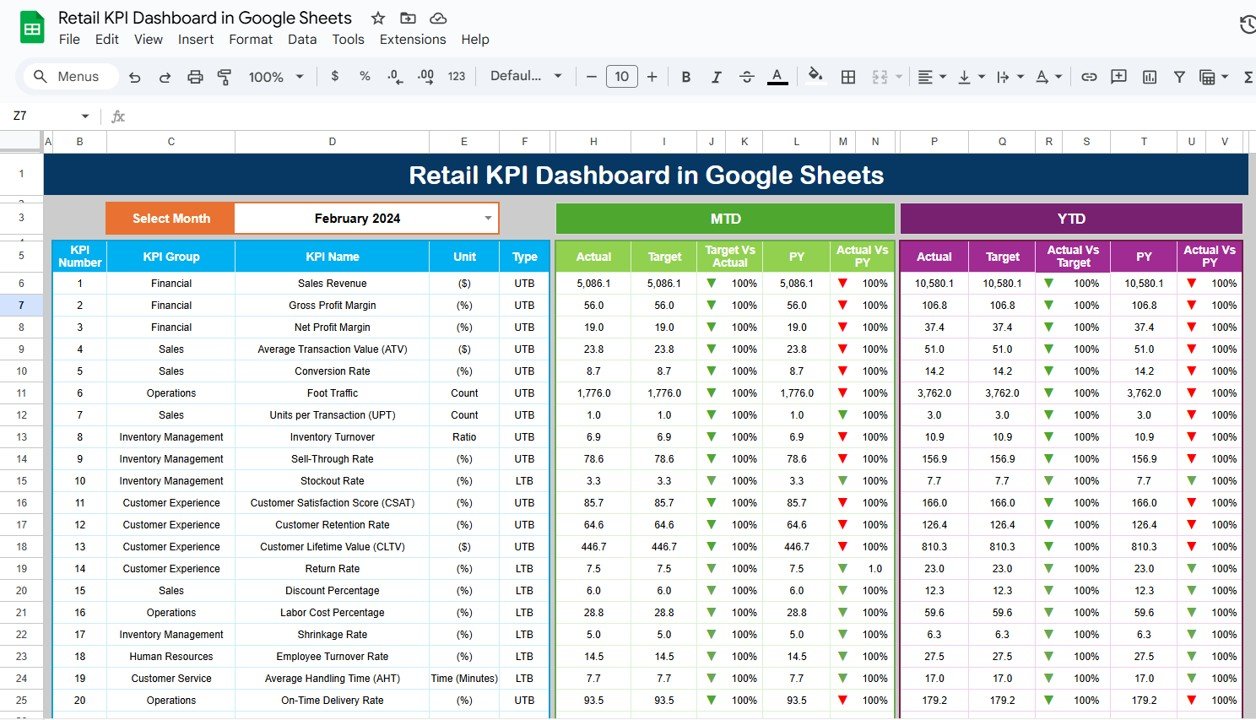
This is the main sheet where all KPI data is displayed.
-
Month Selection: In Range D3, select the month from the drop-down menu, and the dashboard will update to show data for that month.
-
MTD (Month-to-Date): Displays actual numbers, target values, and comparisons with previous year data using conditional formatting (up or down arrows).
-
YTD (Year-to-Date): Shows cumulative performance with comparisons to target and previous year data.

Click to buy Waste Management KPI Dashboard in Google Sheets
2. KPI Trend Sheet Tab
-
Select KPIs from the dropdown in Range C3.
-
Displays KPI group, unit of measure, type (Lower the Better or Upper the Better), formula, and KPI definition.

Click to buy Waste Management KPI Dashboard in Google Sheets
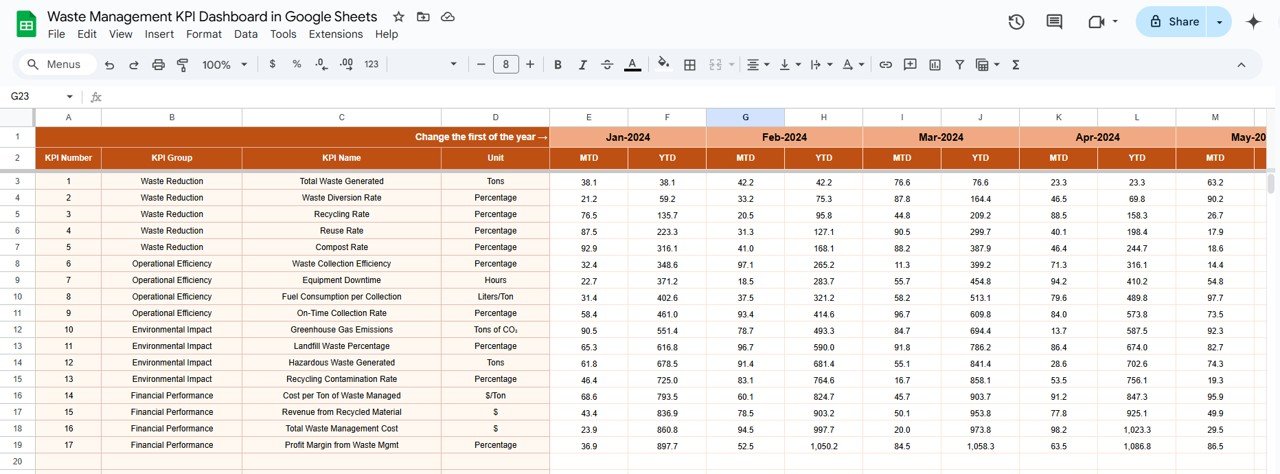
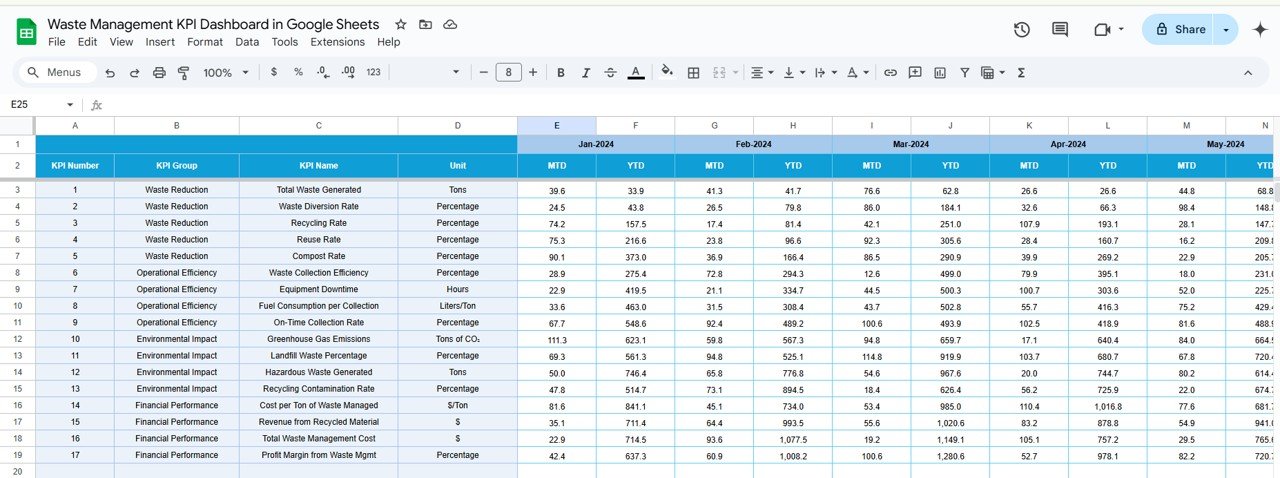
3. Actual Number Sheet Tab
-
Input actual numbers for MTD and YTD for the selected month.
-
The month selection is available in Range E1, where you input the first month of the year.
4. Target Sheet Tab
-
Enter target values for each KPI for MTD and YTD.
-
Helps track performance against the set goals.
Click to buy Waste Management KPI Dashboard in Google Sheets
5. Previous Year Number Sheet Tab
-
Enter previous year’s data for year-over-year comparisons.
-
This data should be entered in the same format as the current year to maintain consistency.

6. KPI Definition Sheet Tab
This sheet contains detailed information for each KPI, including:
- KPI Name
- KPI Group
- Unit of Measure
- Formula for KPI Calculation
- Definition of the KPI

Click to buy Waste Management KPI Dashboard in Google Sheets
Advantages of Using the Waste Management KPI Dashboard in Google Sheets
The Waste Management KPI Dashboard in Google Sheets offers several benefits:
-
Real-Time Data: Monitor KPIs in real-time to make immediate adjustments in your waste management processes.
-
Customizable Templates: Modify the dashboard to fit the specific KPIs that are important to your waste management strategy.
-
Cost-Effective: Google Sheets is free and easy to use, making it an affordable solution for waste management.
-
Collaborative: Share the dashboard with team members to ensure everyone is aligned on waste management goals and performance.
-
Accessibility: The dashboard can be accessed from any device with internet connectivity, providing flexibility for remote teams.
Opportunities for Improvement in the Waste Management KPI Dashboard
While the Waste Management KPI Dashboard in Google Sheets is a powerful tool, there are opportunities for improvement:
Automating Data Entry:
- Current Challenge: Manual data entry can be prone to errors and time-consuming.
- Opportunity: Integrate the dashboard with waste management systems or IoT devices to automate data entry and improve accuracy.
Advanced Visualizations:
- Current Challenge: Basic visualizations may not provide deep insights.
- Opportunity: Add advanced visualizations, such as interactive charts, heatmaps, or graphs, to improve understanding and data interpretation.
Customizable Reporting:
- Current Challenge: Reporting capabilities are basic.
- Opportunity: Expand reporting features by allowing users to generate detailed, customizable reports, such as PDF exports or automated email reports.
Best Practices for Using the Waste Management KPI Dashboard
To get the most out of the Waste Management KPI Dashboard in Google Sheets, consider these best practices:
-
Update Regularly: Ensure that data is updated frequently to keep track of waste management operations and performance.
-
Set Realistic Targets: Use historical data and industry standards to set achievable KPIs.
-
Review Trends: Regularly analyze trends to identify areas for improvement and optimize waste management strategies.
-
Encourage Collaboration: Share the dashboard with relevant team members to ensure everyone is aligned on goals and performance.
-
Leverage Conditional Formatting: Use color-coding or up/down arrows to quickly highlight trends, such as increased waste generation or reduced recycling rates.
Conclusion
The Waste Management KPI Dashboard in Google Sheets is a valuable tool for monitoring and optimizing waste management efforts. By using this dashboard, businesses can track key metrics like waste diversion, recycling rates, and landfill contributions to improve sustainability and cost-efficiency in waste management operations.
Frequently Asked Questions (FAQs)
Click to buy Waste Management KPI Dashboard in Google Sheets
What is a KPI in waste management?
A KPI (Key Performance Indicator) in waste management is a measurable value used to track and evaluate the effectiveness of waste management processes. Common KPIs include waste diversion rate, recycling rate, and landfill emissions.
How do I customize my Waste Management KPI Dashboard?
You can easily customize the dashboard by adding, removing, or adjusting KPIs, formulas, and layout according to your specific waste management needs.
How do I enter data into the Waste Management KPI Dashboard?
Simply input actual numbers for MTD and YTD in the relevant sheets (Actual Numbers Sheet, Target Sheet, Previous Year Numbers Sheet) for each month.
Can I automate data entry?
Yes, you can integrate the dashboard with other waste management systems or IoT devices to automate data entry and reduce manual work.
Which KPIs should I track in waste management?
Key KPIs for waste management include waste diversion rate, recycling rate, landfill gas emissions, and waste management cost per unit.
Visit our YouTube channel to learn step-by-step video tutorials
Youtube.com/@NeotechNavigators
Watch the step-by-step video Demo:
Click to buy Waste Management KPI Dashboard in Google Sheets