Water is one of the most valuable and limited resources for industries, municipalities, utilities, manufacturing plants, campuses, and commercial facilities. As water costs rise and sustainability regulations tighten, organizations must monitor water consumption carefully. However, when water data stays scattered across meters, reports, and spreadsheets, teams struggle to track efficiency and control waste.
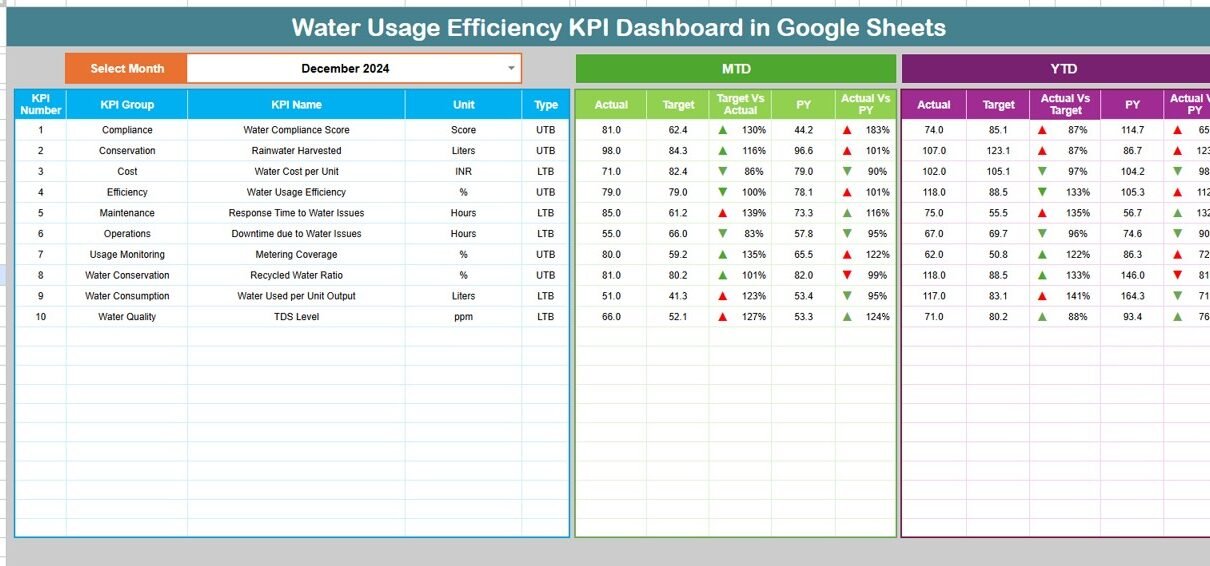
This is where a Water Usage Efficiency KPI Dashboard in Google Sheets becomes extremely useful. It provides a structured, visual, and easy-to-use system to track water usage performance using key metrics. Moreover, it helps organizations compare actual usage against targets and previous years, identify inefficiencies, and improve water conservation strategies.Water Usage Efficiency KPI Dashboard in Google Sheets
In this article, we explain how this ready-to-use dashboard works, which KPIs it includes, how each worksheet functions, and how organizations can use it to improve water efficiency and sustainability.Water Usage Efficiency KPI Dashboard in Google Sheets
What Is a Water Usage Efficiency KPI Dashboard in Google Sheets?
A Water Usage Efficiency KPI Dashboard is a centralized reporting tool that tracks water consumption, efficiency ratios, losses, and conservation performance. It converts raw water usage data into meaningful KPIs with clear visuals.
Because it is built in Google Sheets, the dashboard offers:
-
Real-time updates
-
Easy collaboration
-
Automated calculations
-
No expensive software
-
High flexibility and customization
The dashboard supports both MTD (Month-to-Date) and YTD (Year-to-Date) analysis, which helps teams monitor short-term and long-term performance.
Dashboard Structure and Worksheets
Click to Buy Water Usage Efficiency KPI Dashboard in Google Sheets
This Water Usage Efficiency KPI Dashboard includes 6 structured worksheets, each designed for a specific purpose.
Dashboard Sheet Tab (Main Page)
This is the primary view for management and decision-makers.
🔹 Month Selector
-
Located in cell D3
-
Selecting a month updates the entire dashboard automatically
🔹 Metrics Displayed
MTD Section
-
MTD Actual
-
MTD Target
-
MTD Previous Year
-
Target vs Actual
-
PY vs Actual
YTD Section
-
YTD Actual
-
YTD Target
-
YTD Previous Year
-
Target vs Actual
-
PY vs Actual
🔹 Conditional Formatting
-
⬆ Green arrow = improved performance
-
⬇ Red arrow = poor performance
This makes performance interpretation instant and visual.

Click to Buy Water Usage Efficiency KPI Dashboard in Google Sheets
KPI Trend Sheet Tab
This sheet focuses on one KPI at a time.
🔹 KPI Selection
-
Dropdown available in cell C3
🔹 Information Displayed
-
KPI Group
-
Unit of Measure
-
KPI Type (Lower the Better / Upper the Better)
-
KPI Formula
-
KPI Definition
🔹 Trend Analysis
-
Month-wise performance trend
-
Helps identify seasonal patterns, leaks, or inefficiencies

Click to Buy Water Usage Efficiency KPI Dashboard in Google Sheets
Actual Number Sheet Tab
This sheet stores actual water usage values.
🔹 Key Features
-
Enter MTD and YTD actual numbers
-
Select the first month of the year in cell E1
-
The sheet automatically aligns all months
This sheet feeds real performance data into the dashboard.

Click to Buy Water Usage Efficiency KPI Dashboard in Google Sheets
Target Sheet Tab
This sheet stores planned or benchmark values.
🔹 Purpose
-
Define water efficiency goals
-
Set monthly and yearly targets
-
Compare planned vs actual performance
Targets help organizations drive continuous improvement.

Click to Buy Water Usage Efficiency KPI Dashboard in Google Sheets
Previous Year Number Sheet Tab
This sheet stores last year’s water usage data.
🔹 Why It Matters
-
Enables year-over-year comparison
-
Highlights long-term efficiency improvement
-
Supports sustainability reporting

Click to Buy Water Usage Efficiency KPI Dashboard in Google Sheets
KPI Definition Sheet Tab
This is the reference sheet for all KPIs.
🔹 Contains
-
KPI Name
-
KPI Group
-
Unit
-
Formula
-
KPI Definition
-
KPI Type (LTB / UTB)
This ensures clarity and consistency across teams.

Click to Buy Water Usage Efficiency KPI Dashboard in Google Sheets
Advantages of the Water Usage Efficiency KPI Dashboard
-
Improves water conservation decisions
-
Reduces operational costs
-
Identifies leaks and inefficiencies early
-
Supports sustainability and ESG reporting
-
Enables real-time monitoring
-
Easy to use and maintain
-
Works across locations and departments
Opportunities for Improvement
Click to Buy Water Usage Efficiency KPI Dashboard in Google Sheets
Organizations can enhance this dashboard by:
-
Integrating smart water meters
-
Adding department-wise consumption tracking
-
Including carbon footprint metrics
-
Automating alerts for abnormal usage
-
Adding predictive consumption forecasting
Best Practices for Using the Dashboard
-
Update actual data regularly
-
Set realistic and achievable targets
-
Monitor variance KPIs weekly
-
Focus on loss and leakage KPIs
-
Encourage water reuse initiatives
-
Review YTD trends during sustainability reviews
Conclusion
Click to Buy Water Usage Efficiency KPI Dashboard in Google Sheets
A Water Usage Efficiency KPI Dashboard in Google Sheets gives organizations complete visibility into how water is consumed, wasted, and conserved. It transforms raw meter readings into actionable insights. Because it is simple, flexible, and cloud-based, teams can monitor performance continuously and take corrective action quickly. With the right KPIs and disciplined usage, this dashboard becomes a powerful tool for cost control, compliance, and sustainability leadership.
Frequently Asked Questions (FAQs)
1. Who should use this dashboard?
Facilities teams, sustainability managers, utilities, manufacturing plants, and campuses.
2. Can this dashboard support multiple sites?
Yes, you can add site or location as a dimension.
3. Is Google Sheets reliable for KPI dashboards?
Yes, it offers real-time updates and strong collaboration.
4. Can I add more KPIs?
Yes, the KPI Definition sheet allows full customization.
5. Does it support MTD and YTD tracking?
Yes, both are built into the dashboard.
6. Can I use it for sustainability reporting?
Absolutely, it supports ESG and water efficiency reporting.
Visit our YouTube channel to learn step-by-step video tutorials
Youtube.com/@NeotechNavigators
Watch the step-by-step video tutorial:
Click to Buy Water Usage Efficiency KPI Dashboard in Google Sheets