Managing projects efficiently requires clear timelines, task organization, and tracking. The Weekly Project Plan (Gantt Chart) in Google Sheets is a ready-to-use template designed to simplify project management by providing a visual timeline, task progress tracker, and project status monitoring—all in a customizable Google Sheets format.Weekly Project Plan (Gantt Chart) in Google Sheets
In this blog post, we’ll walk you through the key features of the Weekly Project Plan (Gantt Chart) and explain how it can help you plan, monitor, and execute your projects with ease.
What is a Gantt Chart?
A Gantt Chart is a powerful project management tool that visually represents a project’s timeline. It breaks down tasks, assigns them start and end dates, and tracks their progress over time. With its easy-to-read format, it helps project managers visualize overlapping tasks, identify bottlenecks, and adjust schedules as needed.
The Weekly Project Plan (Gantt Chart) template in Google Sheets provides all the benefits of a traditional Gantt chart, but with the added advantage of real-time updates and easy collaboration using Google Sheets.
Key Features of the Weekly Project Plan (Gantt Chart) in Google Sheets
Click to buy Weekly Project Plan (Gantt Chart) in Google Sheets
The Weekly Project Plan (Gantt Chart) offers various features designed to streamline project planning and tracking. Here are the key features:
1. Tracker Section
The Tracker Section allows you to track essential project details for every activity or task:
-
Activity List: Each task is listed in rows (e.g., Activity 1 to Activity 20). You can easily add or remove tasks depending on your project.
-
Start/End Dates: Track the start and end dates for each task.
-
Duration (Weeks): Automatically calculated based on the start and end dates of each task.
-
Status Dropdown: This dropdown allows you to choose the task’s status:
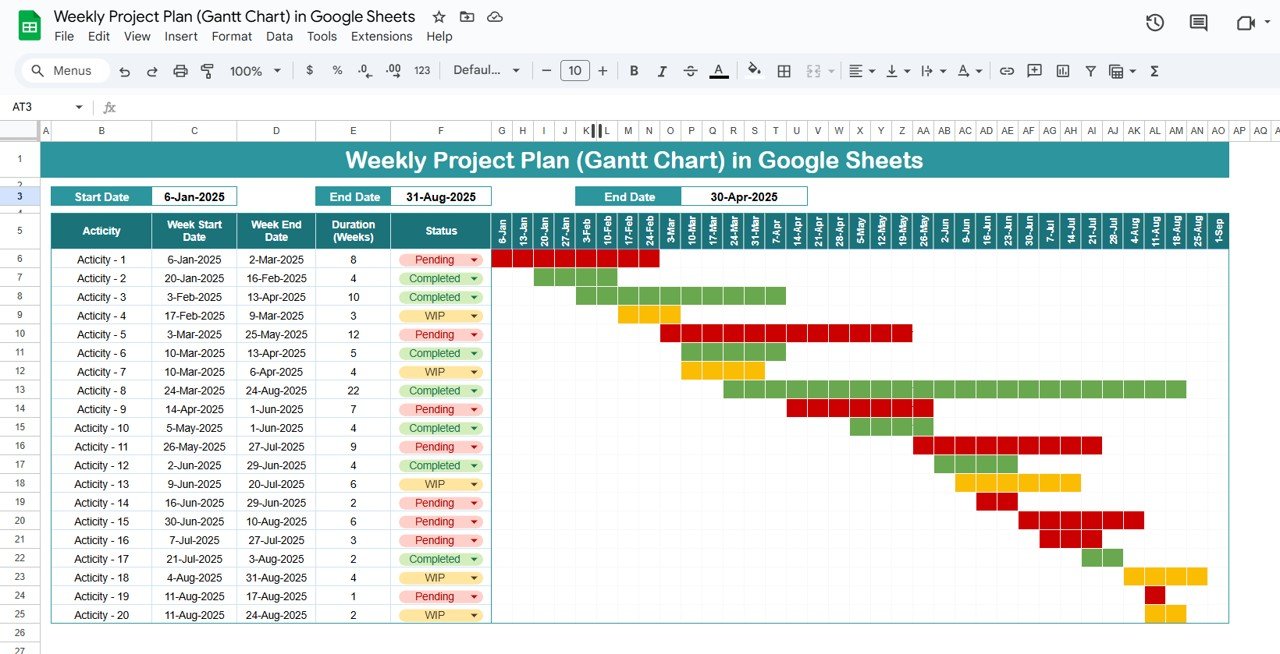
2. Gantt Chart
The Gantt Chart provides a week-wise, horizontal timeline from January to September 2025.
-
Conditional Color Formatting: Based on the status of each task, color formatting is applied to the Gantt bars. The tasks will be colored as:
- Pending
- WIP
- Completed
Visualize Overlapping Tasks: The Gantt chart visually represents overlapping tasks, making it easier to spot potential schedule bottlenecks and dependencies.
Click to buy Weekly Project Plan (Gantt Chart) in Google Sheets
3. Time Management Made Easy
The Weekly Project Plan (Gantt Chart) is designed for easy time management:
-
Dynamic Date Arrangement: Dates are dynamically arranged weekly across the columns. Adjusting the start and end dates for tasks will reflect immediately on the Gantt chart.
-
Row Duplication: Easily duplicate rows for adding new activities or tasks.
How to Use the Weekly Project Plan (Gantt Chart) in Google Sheets
Using the Weekly Project Plan (Gantt Chart) is straightforward. Here’s how to get started:
-
Enter Task Details: Add the tasks to the Activity List with their corresponding start and end dates.
-
Track Duration: The Duration column will automatically calculate the duration based on the start and end dates.
-
Set Task Status: Select the task status (Pending, WIP, or Completed) from the dropdown for each task.
-
Monitor Progress: As the tasks progress, the Gantt chart will update with the appropriate color code, reflecting the task’s status.
-
Adjust Dates: If any task’s start or end date changes, adjust the date in the respective column, and the changes will be reflected in the Gantt chart.
Advantages of Using the Weekly Project Plan (Gantt Chart)
Click to buy Weekly Project Plan (Gantt Chart) in Google Sheets
The Weekly Project Plan (Gantt Chart) offers several advantages:
-
Improved Visibility: The Gantt chart provides a clear visual representation of project timelines, task statuses, and dependencies.
-
Real-Time Updates: The dynamic nature of Google Sheets allows for immediate updates to the timeline as project details change.
-
Better Collaboration: Easily share the Gantt chart with your team to keep everyone aligned on deadlines and progress.
-
Time Management: Track and manage multiple tasks simultaneously, making it easier to meet project deadlines.
-
Task Prioritization: Visualize overlapping tasks and identify potential delays, so you can prioritize tasks accordingly.
Best Practices for Using the Weekly Project Plan (Gantt Chart)
To get the most out of the Weekly Project Plan (Gantt Chart), follow these best practices:
-
Update Regularly: Update the status of each task and adjust timelines as necessary to keep the project on track.
-
Use Color Coding Effectively: Use the color-coded status to visually monitor progress and identify bottlenecks.
-
Set Realistic Deadlines: Ensure that deadlines are achievable and realistic to avoid unnecessary stress or project delays.
-
Collaborate with Your Team: Share the Gantt chart with your project team to ensure everyone is on the same page and aware of their responsibilities.
-
Plan Ahead: Anticipate potential delays by adding buffer time and adjusting tasks as necessary to account for unforeseen issues.
Conclusion
Click to buy Weekly Project Plan (Gantt Chart) in Google Sheets
The Weekly Project Plan (Gantt Chart) in Google Sheets is a versatile tool for managing project timelines, tasks, and progress. By offering a clear, visual timeline and simple task tracking features, it makes project management more efficient and accessible. Whether you’re managing a large project or a small team, this Gantt chart template ensures you stay on top of deadlines, prioritize effectively, and communicate seamlessly with your team.
Frequently Asked Questions (FAQs)
1. Can I add more activities to the Gantt chart?
Yes, you can easily duplicate rows to add more activities to the plan.
2. Can I change the Gantt chart view to a different time frame?
Yes, you can adjust the timeline and dates in the Tracker Section to accommodate different project durations.
3. How can I update the status of tasks?
Simply use the dropdown menu in the Status column to update the status to Pending, WIP, or Completed.
4. Can I share this Gantt chart with my team?
Yes, since it’s in Google Sheets, you can easily share the Gantt chart with team members, ensuring real-time collaboration.
5. Can I use this template for multiple projects?
Yes, you can create separate sheets for different projects or add additional rows to track tasks for multiple projects.
Visit our YouTube channel to learn step-by-step video tutorials
Youtube.com/@NeotechNavigators
Click to buy Weekly Project Plan (Gantt Chart) in Google Sheets
Watch the step-by-step video tutorial: