Workforce planning helps organizations ensure that the right people are in the right roles at the right time. It improves productivity, optimizes labor costs, supports strategic decisions, and prevents talent gaps.Workforce Planning KPI Dashboard in Google Sheets
However, analyzing workforce data manually can lead to errors, delays, and poor decision-making.
The Workforce Planning KPI Dashboard in Google Sheets provides a smart, real-time solution to track workforce capacity, hiring performance, labor cost efficiency, employee utilization, and long-term workforce needs.Workforce Planning KPI Dashboard in Google Sheets
In this article, you will learn how the dashboard works and see a complete list of KPIs with units, formulas, definitions, and KPI type.
What Is a Workforce Planning KPI Dashboard?
The Workforce Planning KPI Dashboard is a Google Sheets–based tool designed to track key workforce indicators, including:
-
Staffing levels
-
Hiring pipeline
-
Employee utilization
-
Labor cost
-
Capacity planning
-
Workforce distribution
-
Headcount trends
It provides MTD/YTD performance, Target vs Actual comparison, PY vs Actual benchmarks, and trend charts.
Why Use Google Sheets for Workforce Planning?
Click to Buy Workforce Planning KPI Dashboard in Google Sheets
Google Sheets provides:
-
Real-time data access
-
Multi-user collaboration
-
Easy customization
-
Built-in charts and formulas
-
Zero software licensing cost
This dashboard is ideal for HR teams, workforce analysts, project managers, and leadership teams.
Dashboard Structure and Sheet Tabs
The Workforce Planning KPI Dashboard includes 6 worksheets, each with a specific purpose.
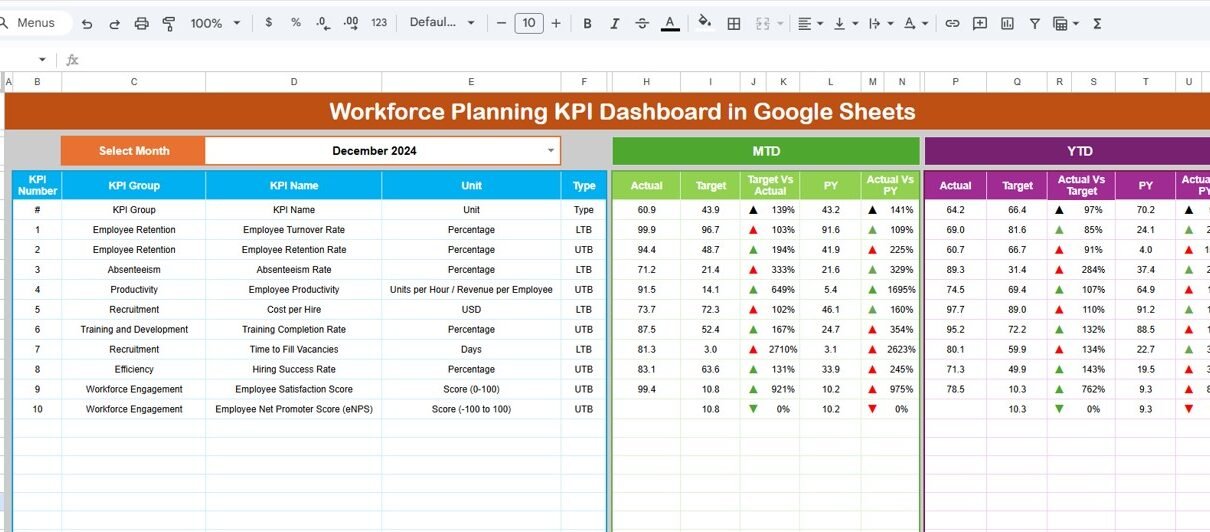
1. Dashboard Sheet Tab
This is the main dashboard.
-
Select the month in Range D3
-
Dashboard auto-updates instantly
MTD and YTD view of:
- Actual
- Target
- Previous Year (PY)
- Target vs Actual (with arrows)
- PY vs Actual (with arrows)
This gives clear visibility into workforce performance.

Click to Buy Workforce Planning KPI Dashboard in Google Sheets
2. KPI Trend Sheet Tab
You can select a KPI in Range C3 to view:
-
KPI Group
-
KPI Unit
-
KPI Type (Upper / Lower the Better)
-
KPI Formula
-
KPI Definition
-
Trend chart
Perfect for analyzing long-term workforce trends.

3. Actual Number Sheet
Enter:
-
MTD Actual values
-
YTD Actual values
You can change the reporting month in Range E1.

Click to Buy Workforce Planning KPI Dashboard in Google Sheets
4. Target Sheet
Enter monthly and YTD targets for each KPI.

5. Previous Year Sheet
Enter previous year’s MTD and YTD values to enable PY comparison.

Click to Buy Workforce Planning KPI Dashboard in Google Sheets
6. KPI Definition Sheet
Contains:
-
KPI Name
-
KPI Group
-
Unit
-
Formula
-
KPI Definition
-
Performance Type

Advantages of the Workforce Planning Dashboard
-
All KPIs in one consolidated place
-
Strong visibility into workforce capacity
-
Better hiring and staffing decisions
-
Improved productivity tracking
-
Accurate labor cost management
-
Easy to interpret charts and trends
-
Fully cloud-based and shareable
Opportunities for Improvement
Click to Buy Workforce Planning KPI Dashboard in Google Sheets
Add enhancements such as:
-
Predictive forecasting using formulas
-
Workforce heatmaps
-
Skill matrix integration
-
Automated alerts for vacancies or overtime
-
Role-based dashboards for managers
Best Practices
-
Update Actual and Target sheets monthly
-
Review hiring and utilization KPIs weekly
-
Compare PY performance for long-term trends
-
Set realistic workforce capacity targets
-
Use KPI Trend Sheet for forecasting
-
Share insights with managers regularly
Conclusion
Click to Buy Workforce Planning KPI Dashboard in Google Sheets
The Workforce Planning KPI Dashboard in Google Sheets helps HR and leadership teams make data-driven decisions about workforce size, hiring needs, labor cost, and employee utilization. With clear KPIs, trends, and automated comparisons, this dashboard improves workforce planning accuracy and organizational efficiency.
Frequently Asked Questions (FAQs)
1. What KPIs does this dashboard track?
It tracks hiring, headcount, labor cost, utilization, capacity, forecasting, and skill gaps.
2. Can I customize the KPIs?
Yes, all KPIs can be updated in the KPI Definition tab.
3. Does the dashboard compare against targets and last year?
Yes, it provides MTD/YTD comparisons with both target and previous year.
4. Is the dashboard easy to update?
Yes, simply update the Actual, Target, and PY sheets.
5. Can multiple users collaborate?
Yes, Google Sheets supports real-time multi-user editing.
Visit our YouTube channel to learn step-by-step video tutorials
Youtube.com/@NeotechNavigators
Watch the step-by-step video Demo:
Click to Buy Workforce Planning KPI Dashboard in Google Sheets